
Turn Sales Into Predictable Growth With a Repeatable Pipeline


The arithmetic that converts a revenue target into a weekly activity number, the pipeline stage that is quietly costing you the quarter, and the follow-up schedule that recovers deals you already paid to create.
Sales become predictable when you can name how many conversations produce one sale, and then repeat that number on purpose every week. Work backwards from the revenue target through average deal size and each conversion rate until you reach a weekly outreach count, fix whichever stage leaks hardest before adding leads, and put follow-up on a written schedule. The rest is review: four numbers, every Monday, for a full quarter before you change the plan.

Quick answer
The target sets the deals, the rates set the week
Predictable growth is a division problem you solve once and then repeat. Divide the revenue target by average deal size to get deals, then by each conversion rate to get proposals, conversations and outreach attempts. That last figure is what goes in the calendar. Measure your real rates for one full sales cycle before you trust them, fix the stage that leaks worst rather than buying more leads, and keep the plan unchanged long enough to read the result.
Start at the Revenue Target and Divide Backwards
Growth stops being a mood the moment you write the arithmetic down. Take the revenue number, divide by your average deal size, and you have the count of deals. Divide by the close rate and you have proposals. Keep dividing until you reach outreach attempts, because that is the only link in the chain anyone controls directly.
Run it once with real figures. A $120,000 quarter at a $6,000 average deal is 20 deals. Close one proposal in four and you need 80 proposals. If half your genuine conversations end in a proposal, that is 160 conversations, and at a one in ten reply rate roughly 1,600 outreach attempts fill the quarter. Nobody enjoys reading that last number. Reading it is the point.
Two useful things fall out immediately. First, whether the target is reachable at all with the hours you have, which is far cheaper to discover in a spreadsheet than in month three. Second, which lever costs the least: lifting average deal size from $6,000 to $7,500 removes four deals from the quarter, and that is usually easier than finding another 400 touches. Once the chain holds for a quarter, the plan and the money start to agree, which is the ground our cash flow system for small businesses builds on.
Fix the Leaking Stage Before You Buy More Leads

Write the chain down and one stage is always worse than the rest. Pouring leads into a pipeline that loses people at the proposal step simply pays the same toll more often, and it is the most expensive habit in small business selling.
| Stage | What the number really measures | The usual failure | What to change first |
|---|---|---|---|
| Outreach | Whether you are reaching the right list at all. | A broad list and a generic message, so replies arrive from people who will never buy. | Cut the list in half and rewrite the first line for the half that remains. |
| Conversation | Whether the offer matches the problem the person actually has. | Talking about features before anyone has stated a problem out loud. | Spend the first ten minutes on their situation and qualify out fast. |
| Proposal | Whether you understood the requirement well enough to price it. | Quoting before scope is settled, then revising twice and losing momentum. | Confirm scope in writing before the number exists. |
| Close | Whether the buyer has a reason to decide this month. | Silence after the quote, mistaken for rejection and never followed up. | Book the next contact date while you are still on the call. |
The honest limit here is sample size. If you closed six deals last quarter, a rate that reads 33 percent could just as easily be 20, and rebuilding a whole process on six data points is guesswork with a chart on it. Small teams should look for the stage that is obviously broken rather than the one that is two points behind, and revisit the fine detail after a full year of logged activity. A leave-behind that answers the objections you keep hearing quietly lifts the proposal stage, which is where the choice between a brochure and a sales sheet stops being cosmetic.
Turn Follow-Up Into a Schedule Anyone Can Run

Most lost deals were never rejected. They were contacted twice, filed under maybe, and quietly forgotten while everyone stayed busy. A written cadence fixes more revenue than a new script, because it removes the daily decision about who to chase.
A workable sequence for a six week cycle looks like this, and the dates matter more than the wording:
- Day 0. The meeting or the enquiry. Book the next contact before it ends.
- Day 1. A short summary email with the scope as you heard it, and the printed leave-behind if you met in person.
- Day 4. The proposal, sent when you said you would send it.
- Day 8 and day 15. Two short check-ins that add something new rather than asking for a decision again.
- Day 30. Move it to the nurture list. Nothing is dead, it is just not this month.
- Day 90. A reactivation mailing to everything sitting on that nurture list.
The last two steps are where print earns its place, because a dormant contact who stopped opening your email will still turn over a card that landed on their desk. Standard postcards start at $16.48, which makes a quarterly sweep of a few hundred lapsed accounts one of the cheapest lines in the plan, and our breakdown of direct mail cost per piece shows how postage changes the maths at volume. For the day one leave-behind, sales sheets at $75.80 keep your figures in the room after you walk out, while standard brochures at $57.11 suit a longer story with several products in it. Put a distinct landing page or code on each piece so the response is counted rather than assumed, the same discipline described in postcard marketing that converts.
Grow From the Back of the Funnel, Not Just the Front
The cheapest deal you will book this quarter is the second one from a customer you already have. No qualifying, no proposal cycle, no fight over price with someone who has never worked with you. Yet most growth plans spend their whole budget on strangers.
Three moves make the back of the funnel produce forecastable revenue. Set a fixed contact rhythm for existing accounts, so someone reaches every customer on a schedule instead of when a problem appears. Give people a specific reason to buy again rather than a general reminder that you exist, which is the whole subject of building a marketing offer that rewards loyal customers. And ask for referrals at the moment the work went well, not at renewal, because the request lands very differently the week after a good result.
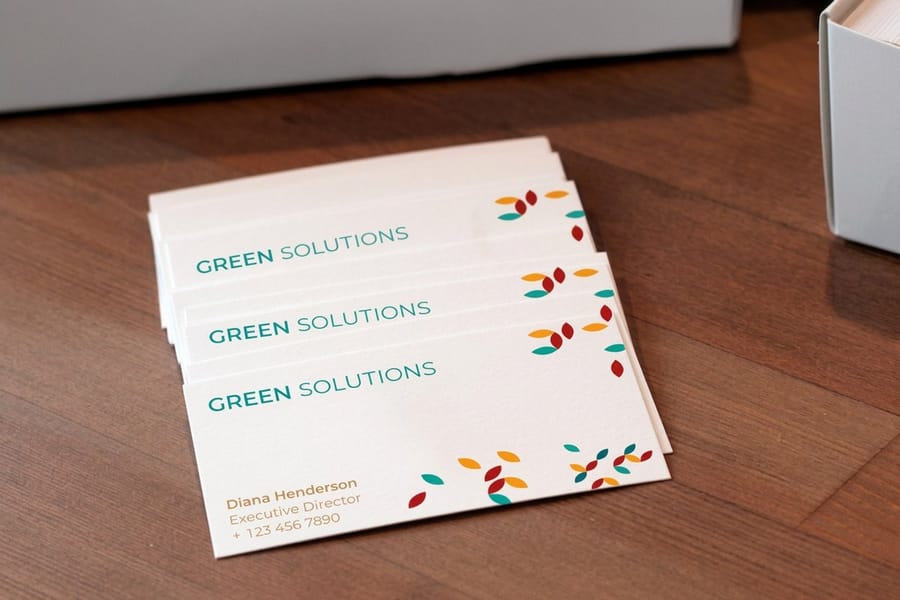
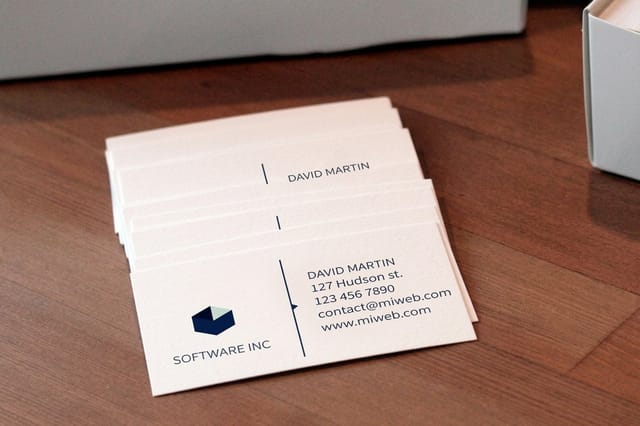
Referrals need something physical to travel with, which is the unglamorous reason standard business cards at $17.57 still outlive every prediction of their death. A customer recommending you needs a name to hand over, and a card in a wallet survives the conversation that a forwarded email does not. Order for the people who meet customers, not for the whole company, and browse business card printing when the stock and finish start mattering more than the count.
Review the Same Four Numbers Every Week

A forecast that is only checked at quarter end is a report, not a tool. The review that changes anything happens weekly, takes about fifteen minutes, and never argues about the annual target.
Look at four things. New opportunities that entered the pipeline this week, opportunities that moved a stage, anything untouched for fourteen days, and the total value at the proposal stage. The first two are leading indicators and you can still act on them. Revenue is a lagging indicator and it only tells you about decisions made weeks ago.
Guard against one trap. When a week looks thin, the instinct is to change the plan, and constant replanning destroys the very consistency that made the numbers meaningful. Hold the plan for a full quarter, change one variable at a time, and let each change run long enough to read. When the pipeline finally does hold steady and you are ready to add territory, headcount or a new line, the strategies for expanding a business pick up where this leaves off, and events remain one of the few reliable ways to load the top of the funnel on a date you choose, which the trade show planning checklist lays out from booking to follow-up. If the whole plan is still on a napkin, start with a small business marketing plan and bring the pipeline arithmetic into it.
Wally explains predictable growth
Start at the money, divide until it fits in a week
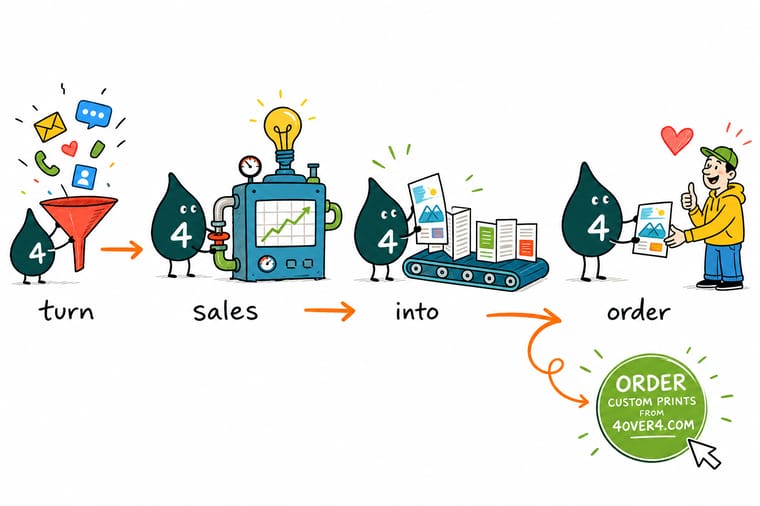
Wally writes the revenue target at the bottom of the board and divides upward. Average deal size gives him the number of deals. The close rate gives him proposals. The reply rate gives him calls. By the time he reaches the top he is holding a number he can put in Monday morning, not a wish. Then he checks which stage loses the most people and fixes that one first, because pouring more names into a leaking funnel only makes the leak busier.
Print sales sheets for the follow-up →Specs and pricing
The print pieces the pipeline actually uses
Sizes, stocks and starting prices straight from the 4OVER4.COM configurator, for the leave-behind, the reactivation mailer and the card that travels with a referral.



Print it
Equip the follow-up sequence


Explore more
Where to go next





By the numbers
The print partner behind the plan
Common Questions
Your predictable growth questions, answered
What actually makes sales predictable?
A measured conversion rate at every stage, plus enough volume that the rate holds from month to month. Once you know that ten outreach attempts produce one conversation and four proposals produce one deal, the revenue target converts into a weekly activity number. Below roughly ten deals a quarter the rates wobble too much to forecast tightly, so small teams should plan in quarters rather than weeks and widen the range they promise anyone.
How long does it take before the numbers mean anything?
Long enough for a full sales cycle to run twice. If your average deal takes six weeks from first contact to signature, you need about three months of logged activity before the conversion rates are worth acting on. Anything measured over two weeks is noise. Log the stage each opportunity sits in from day one, even in a spreadsheet, because you cannot go back and reconstruct it later.
Should I fix conversion or add more leads first?
Conversion, almost always. Doubling the number of leads doubles the cost of every stage that follows, while lifting a proposal-to-close rate from 20 to 30 percent costs nothing but better qualifying and faster follow-up. Add volume only once the chain converts at a rate you would be happy to multiply.
Where does printed material fit in a modern pipeline?
At the moments when a screen is not present. A sales sheet left behind after a meeting keeps your numbers in the room after you leave, a postcard reaches a lapsed account that stopped opening email, and a business card is still how a name survives a trade show floor. The measurable version is the one that carries a code or a specific landing page, so the response can be counted like any other channel.
How often should I review the pipeline?
Once a week for activity, once a month for conversion rates, once a quarter for the plan itself. Weekly reviews that argue about the annual target waste everyone. Look at what entered the pipeline this week, what moved a stage, and what has not been touched in fourteen days, then stop. Fifteen minutes done every Monday beats two hours done in a panic at quarter end.
What does it cost to put print back into the follow-up sequence?
Less than most people assume. Standard postcards start at $16.48 at 4OVER4.COM, standard business cards at $17.57, sales sheets at $75.80, and standard brochures at $57.11. A quarterly reactivation mailing to a few hundred dormant accounts is usually the cheapest line in a growth plan, and unlike an ad it keeps working while it sits on someone desk.
Get Started
Sales sheets run 50 for $75.80, or $1.52 each
Print the leave-behind, the reactivation postcard and the card that travels with a referral, then put each one on a date in the calendar instead of a maybe.
Legal Disclaimer
Gold Standard guarantees apply to all standard orders placed through 4over4.com. Price match requires verifiable proof of a competitor's published price for an equivalent product with matching specifications and turnaround time. Satisfaction guarantee covers manufacturing defects and print quality issues. Contact support with order number and documentation. On-time delivery rate based on tracked orders 1999 to 2026. Individual results may vary based on shipping carrier performance.
