
Understanding Business Metrics That Actually Predict Growth


A working set of numbers for a small business: what each one measures, how to calculate it, and the point where each one starts to mislead you.
Five numbers tell you whether a business works: gross margin, contribution margin, customer acquisition cost, lifetime value, and the cash conversion cycle. Revenue is not one of them, because revenue measures how busy you are rather than whether the work pays. Each metric is a division problem, each one needs a denominator you define honestly and then stop moving, and each one hides something the next one exposes.

Quick answer
Every metric is a division problem with an honest denominator
Track margin, acquisition cost, lifetime value on gross profit, payback in months, and cash. Gross margin caps what the business can ever afford. Contribution margin decides whether the next sale is worth taking at that price. Acquisition cost prices growth, and only means something when the spend and the new customers come from the same period. Lifetime value has to be multiplied by gross margin before it can be compared to acquisition cost. Cash is the constraint that outranks all of them, because a profitable company with no cash still closes.
Margin Comes Before Revenue
Revenue is the easiest number to move and the least useful to know. Cut prices and revenue can rise. Raise prices and revenue can rise. Margin is the number that tells you which of those two things you actually did.
Gross margin is revenue minus the cost of goods sold, divided by revenue. It is the ceiling on everything below it. A business running 22 percent gross margin has 22 cents of every dollar to pay for rent, payroll, marketing and profit, and selling twice as much does not change the fraction.
Contribution margin takes one more step and subtracts the variable cost of selling: shipping, payment processing, sales commission, the packaging that leaves with each order. What remains is what one additional sale contributes toward the fixed costs. This is the number to check when a customer asks for 15 percent off, because a product with a comfortable gross margin can have almost no contribution margin left once free shipping and a processing fee come out of it.
Operating margin subtracts the fixed costs too. It answers whether the business as it is currently built makes money, which is a different question from whether the product is any good.
| Margin | What it subtracts | What it answers | Where it misleads |
|---|---|---|---|
| Gross | Cost of goods sold only. | Can this product line ever carry the business? | Ignores the cost of selling, so a low-touch product and a high-touch product look identical. |
| Contribution | Cost of goods plus variable selling cost. | Is one more sale at this price worth taking? | Says nothing about whether total volume covers the rent. |
| Operating | Everything except interest and tax. | Does the business as built make money? | Moves for reasons unrelated to the product, such as a lease renewal. |
| Net | Everything, interest and tax included. | What reaches the owner. | The most quoted and the least actionable, because little of what moves it is a weekly decision. |
Work down that table in order. Most owners quote gross margin in conversation and manage on net margin at year end, which leaves the two middle rows, the ones you can actually act on, unwatched for eleven months.
What a Customer Costs, From the Ad Spend to the Business Card

Customer acquisition cost is total sales and marketing spend for a period divided by the new customers won in that period. The arithmetic is trivial. The honesty sits in the two inputs.
Spend means all of it: the ad budget, the salary share of anyone who sells, the software subscriptions, the trade show fee, and the printed collateral. A box of standard business cards at $17.57 or a run of standard postcards at $16.48 sits in the same column as the ad account. Leave the print out and your acquisition cost reads lower than the bank statement says it is.
New customers means new. A repeat order from someone who bought last quarter is retention, and counting it in the denominator makes acquisition look cheap right up to the month new demand stops. Keep two versions of the number: blended acquisition cost divides all spend by all new customers, and paid acquisition cost divides paid spend by the customers you can attribute to paid channels. Blended will always look better, because it lets your paid budget take credit for word of mouth. The distance between the two numbers is a fair estimate of how much of your growth is organic.
Lifetime value is average order value, multiplied by orders per year, multiplied by the years a customer stays, and then multiplied by gross margin. That last multiplication is the one people skip. At 40 percent gross margin, a lifetime value to acquisition cost ratio that looks like 3 to 1 on revenue is 1.2 to 1 on gross profit. The first number describes a business. The second describes a treadmill.
Payback period is acquisition cost divided by monthly gross profit per customer, expressed in months. Inside 12 months, the customers you win pay for the next ones and you can grow from your own cash. Past 18 months you are financing your marketing, and a strong ratio will not save you from that. Where the money goes matters as much as how much of it there is, which is the split covered in our guide to the difference between marketing and branding, and the message on the piece is set out in brand messaging for small business.
How to Measure a Postcard Campaign Like a Paid Ad

Offline channels are not unmeasurable. They are unmeasured by default, which is a different problem with a cheap fix. Everything an ad platform reports can be rebuilt by hand for a print campaign, and it takes one decision made before the file goes to press: give the piece a response path that exists nowhere else.
- A promo code used only on that piece. Cheapest to set up, and it undercounts, because anyone who responds without redeeming the code never appears in the total.
- A dedicated short URL, or a QR code that points to it. The most informative of the four, since you get sessions and time on page as well as orders, and you can see the people who considered it and left.
- A phone number used only on that mailing. Still the most reliable choice for service businesses, where the real response is a call rather than a click.
- A holdout group. Mail 90 percent of the list and deliberately skip a matched 10 percent, then compare order rates across the same window. It is the only one of the four that measures lift instead of attribution.
With a response path in place, compute the three numbers a paid channel would have given you. Response rate is responses divided by pieces mailed. Cost per response is total campaign cost, print and postage together, divided by responses. Acquisition cost is that same campaign cost divided by new customers, which is always a smaller number than responses and the one that belongs next to your paid acquisition cost.
Two practical notes. Set the code or URL large enough to read at arm's length, because a response path printed at 6 point on the back of a card quietly discards responses you already paid for. And accept the trade-off in the holdout: it is the only clean measurement available, and it costs you the orders that skipped 10 percent would have placed. Run it once a year on your largest campaign rather than on every drop. The list, timing and postage side of the job is covered in how direct mail marketing works, and you can lay the piece out to size from the blank template library.
The Sample Size Problem That Ruins Small Campaigns

Most small campaign readings are noise wearing a decimal point. Mail 500 postcards, collect 6 responses, and the response rate reads 1.2 percent. Mail the same piece to the same kind of list next month and 3 responses or 10 responses would both be unremarkable. At that volume you cannot tell a 1.2 percent piece from a 0.8 percent piece, because the gap between them is a few people having a busy Tuesday.
The thing that has to be large is the count of responses, not the count of pieces. As a working rule, treat any result built on fewer than about 30 responses as a direction rather than a number. At a 1 percent response rate, 30 responses means 3,000 pieces per version, and two versions means 6,000 pieces before the comparison means anything.
That puts a split test out of reach for most small businesses, and pretending otherwise spends real money on a conclusion you cannot trust. What does work at small volume:
- Change one thing at a time across several campaigns instead of running two versions in one drop.
- Change the offer before you change the design. The offer moves response rate more than layout does, and by a wide enough margin to show up at small counts.
- Judge on cost per acquired customer across a quarter rather than response rate on a single drop.
- Hold the list and the piece constant when you test timing, and hold timing constant when you test the piece.
Format changes the arithmetic before any of this starts, because cost per piece sets the response rate you need to break even. Standard flyers start at $39.54 and standard brochures at $57.11, so a brochure has to work considerably harder per piece than a postcard does. Stock and coating shift that cost as well, which is why choosing paper for printed marketing materials is a budget decision as much as a design one, and the full range sits in the business basics printing collection.
Profit and Cash Are Two Different Numbers
A profitable business can run out of money, and it usually happens in the year it grows fastest. Profit is recorded when you invoice. Cash arrives when the customer pays. The space between those two events is where companies quietly fail while the profit and loss statement looks fine.
The cash conversion cycle measures that space in days: days of inventory held, plus the days customers take to pay you, minus the days you take to pay suppliers. A shop holding 40 days of stock, collecting in 45 days and paying suppliers in 30 runs a 55 day cycle. Every extra dollar of sales needs 55 days of funding before it comes back, so doubling revenue means finding twice as much working capital before any of the reward shows up.
There are three levers and each costs you something. Collect faster, through deposits or shorter terms, and some customers will decline. Hold less inventory and you accept a higher chance of stockouts. Pay suppliers later and you spend goodwill, sometimes along with an early payment discount. Pick the lever your business can afford to lose something on, rather than the one that is easiest to describe in a meeting.
Runway is the companion number: cash on hand divided by net monthly burn, in months. Below six months it deserves a weekly look and a 13 week forecast. Above that, monthly is enough. Runway is also the honest constraint on the payback period from the previous section, since a business with nine months of runway cannot fund customers that take 18 months to repay their acquisition cost, however healthy the ratio looks.
The Checklist, Sorted by How Often to Look
The failure mode is not tracking too little. It is tracking everything at the same frequency, which turns a dashboard into wallpaper. Match each number to the speed at which it can actually change.
Weekly:
- Cash in the bank, and the 13 week forecast next to it.
- New customers won, counted as people who had never bought before.
- Cash collected against invoices issued, which is the early warning on your collection days.
- Bookings or pipeline, if your sale takes longer than a week to close.
Monthly:
- Gross margin by product line, which catches supplier price drift before it reaches the year end.
- Contribution margin on your three biggest sellers.
- Blended and paid acquisition cost, kept as two separate rows.
- Response rate and cost per response for any campaign that closed in the month.
Quarterly:
- Lifetime value to acquisition cost, computed on gross profit rather than revenue.
- Payback period in months.
- Cash conversion cycle in days.
- Repeat rate and churn, which need a quarter of history before a change is real.
- Operating margin against the same quarter last year, not against last quarter, so seasonality does not read as a trend.
Once a year, reprice. Then recalculate every number above using the new prices before you commit to them, because a 5 percent price rise at 30 percent gross margin lifts gross profit by roughly a sixth, and that changes what you can afford to pay for a customer.
Keep the whole thing to one page and put it somewhere you pass every day. A printed sheet on the wall gets read; a spreadsheet tab gets opened at month end. If you want it laid out properly, start from a correctly sized layout in the blank template library, or browse the rest of the business set in the business applications guides.
Wally explains business metrics
Every metric is a division problem with an honest denominator
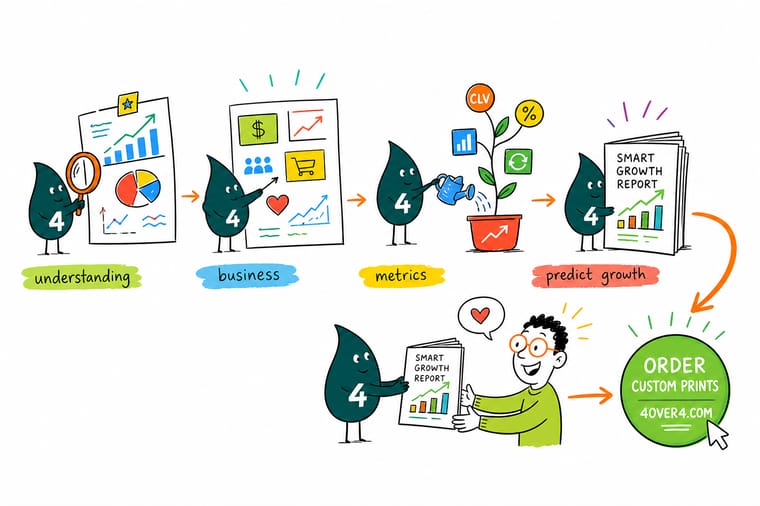
Wally writes one sale on the board and starts subtracting. Cost of goods first, and the gap left behind is gross margin. Then shipping and card fees, which gives contribution margin. Then whatever it cost to win the customer, and what survives is the part that pays the rent. He says the arithmetic was never the hard bit. The hard bit is deciding what belongs on top of the fraction and who counts as a new customer at the bottom, then keeping those definitions when the answer comes out ugly.
Print a campaign you can measure →Specs and pricing
What the measurable formats cost per run
Cost per piece sets the response rate a campaign has to hit before it breaks even. These are the live configuration choices and starting prices from the 4OVER4.COM configurator.



Print it
Put a response path on the piece and the numbers follow



Explore more
Where to go next






By the numbers
The print side of your marketing spend at 4OVER4
Common Questions
Your business metrics questions, answered
Which business metrics should a small business track first?
Start with four and add nothing until those four are reliable. Gross margin, because it caps everything else. Contribution margin on your top three sellers, because it tells you whether the next order at that price is worth taking. Customer acquisition cost, because it prices growth. And cash in the bank against monthly burn, because that is the number that ends companies. Lifetime value, churn and the cash conversion cycle matter, but they need several months of history before they say anything, so they belong in a quarterly review rather than a weekly one.
How do I calculate customer acquisition cost?
Take every dollar of sales and marketing spend inside a period and divide it by the new customers won inside that same period. Spend means the ad budget, the salary share of anyone who sells, the software, the trade show fee and the printed collateral, including a box of cards at $17.57 or a postcard run at $16.48. New customers means people who had never bought before, not repeat orders. Keep two versions: blended acquisition cost uses all spend and all new customers, paid acquisition cost uses only paid spend and the customers you can attribute to it. The gap between the two is roughly the size of your organic engine.
What is a good LTV to CAC ratio?
Three to one is the number most people quote, and it is only useful if the lifetime value was computed on gross profit rather than revenue. Multiply average order value by orders per year, by the years a customer stays, and then by your gross margin. If you skip that last multiplication at a 40 percent margin, a ratio that looks like 3 to 1 is really 1.2 to 1. Pair the ratio with a payback period in months, because a healthy ratio with a 24 month payback still starves a business that has no outside funding.
How do I measure a direct mail or print campaign?
Give the piece a response path that exists nowhere else, decided before the file goes to press: a promo code used only there, a short dedicated URL or a QR code pointing to it, or a phone number used only on that piece. Then compute the same three numbers a paid channel reports. Response rate is responses divided by pieces mailed. Cost per response is total campaign cost divided by responses. Acquisition cost is campaign cost divided by new customers. For lift rather than attribution, hold back a matched 10 percent of the list and compare their order rate over the same window.
What is the difference between gross margin and contribution margin?
Gross margin subtracts only what it cost to make or buy the thing. Contribution margin also subtracts the variable cost of selling it: shipping, payment processing, sales commission, packaging. Gross margin answers whether a product line can ever carry the business. Contribution margin answers whether one more sale at this price is worth taking, which is the question you face when a customer asks for a discount. A product can show a comfortable gross margin and a contribution margin near zero once free shipping and a 3 percent processing fee come out.
How often should I look at these numbers?
Cash weekly, margin monthly, ratios quarterly. Cash and new customers move fast enough that a week is the right resolution, and a 13 week cash forecast is worth more than any other spreadsheet in a small business. Margin by product line changes with supplier prices, so monthly catches drift early. Lifetime value, payback and the cash conversion cycle need a quarter of data before the change is real rather than noise, and reviewing them more often mostly produces false alarms.
Get Started
Postcards run 50 for $16.48, trackable with one code
Add a code or a dedicated URL to the piece before it prints, and by the end of the month you will have a response rate, a cost per response, and an acquisition cost to compare against your ad spend.
Legal Disclaimer
Gold Standard guarantees apply to all standard orders placed through 4over4.com. Price match requires verifiable proof of a competitor's published price for an equivalent product with matching specifications and turnaround time. Satisfaction guarantee covers manufacturing defects and print quality issues. Contact support with order number and documentation. On-time delivery rate based on tracked orders 1999 to 2026. Individual results may vary based on shipping carrier performance.
