
How A/B Testing Works and How to Run Your First Test Properly


The whole method in plain terms: one variable, a random split, a metric picked in advance, and a finish line you set before you start. Plus how to run the same test on a printed piece.
An A/B test shows one audience two versions of something that differ in exactly one way, splits that audience at random, and counts which version produced more of the single action you chose in advance. The random split is what makes the answer trustworthy, because nothing except the version separates the two groups. Everything else in this guide is protection against the two ways beginners lose a test: changing more than one thing, and stopping the moment the numbers look good.

Quick answer
One variable, a random split, and a finish line set in advance
A test is only readable when the two versions differ in one way and the two groups differ in no way. Assign people at random, keep the send time, audience source and destination identical, and change a single element. Choose the metric and the stopping point before launch so the data cannot talk you into a result. Then run both cells over the same window, count each one separately, and act on the winner only if enough responses arrived to tell a real gap from a lucky one.
How an A/B Test Actually Works

An A/B test has five moving parts, and beginners usually get three of them right and lose the test on the other two.
A claim you can be wrong about. Not "improve the landing page" but "free shipping will get more orders than 10 percent off". A hypothesis that cannot fail is not a hypothesis, it is a wish.
Exactly one difference. Version A is the current version, the control. Version B changes one element. Everything else stays byte for byte identical, including the things you did not think about: the send time, the audience source, the page the link lands on.
A random split. Each person is assigned to A or B by a coin flip, not by geography, not by list order, not by who opened last time. The moment the split correlates with anything about the person, you are comparing two audiences instead of two versions.
One primary metric, chosen in advance. Clicks, calls, signups, orders. Pick the one closest to money and commit to it. If you pick after the data arrives, you will pick the metric that happens to look good, and you will do it sincerely.
A finish line set before the start. Decide how many responses each cell needs and when the test ends. Then leave it alone until then.
Those five make the difference between measurement and a story. Skip the random split and you get a geography test. Skip the fixed finish line and you get a test that stops the moment noise happens to favor your preferred version.
Sample Size, and Why Small Tests Lie

This is where most first tests fall apart, and it is pure arithmetic rather than statistics.
Say each version goes to 500 people. A gets 10 responses, B gets 15. That reads as a 50 percent improvement and it is genuinely exciting. It is also five people. Five people who happened to be in a good mood, or who got their mail on a Thursday instead of a Monday. Run the same test again next month and the sides may swap, and nothing about your offer changed in between.
The rule underneath it: the smaller the effect you want to detect, the more responses you need. Detecting a doubling takes very few. Detecting a 5 percent improvement takes an enormous number, which is why the tiny cosmetic tests that fill marketing blog posts almost never produce a trustworthy result for a small business.
Two habits fix most of this. First, test bold changes, because bold changes need less data to prove. A different offer, a different audience, a different format. Second, write down the stopping point before you launch and treat it as binding. Peeking at a running test and stopping when one side leads is called optional stopping, and it manufactures winners out of pure noise, because in any close race one side leads most of the time.
If you do not have the volume for a clean test yet, that is a real answer too. Spend the effort on the offer and the list instead, and keep the measurement simple. Our guide to marketing analytics and ROI covers what to track when the numbers are still too small to split.
Split Testing Offline, Where Every Cell Costs Money

Print gets left out of A/B testing conversations because feedback is slow, and that is a mistake. A mail test has one advantage no website test can match: you control the entire audience list, so the split is genuinely random and nobody is bouncing between versions on two devices.
The mechanics are the same as online, with one addition. Each cell needs its own response path, or the replies arrive in one undifferentiated pile. A unique landing page URL per version, a separate phone extension, a distinct promo code, or a per version QR code all work. The QR route is the least effort to count, and our walkthrough on adding QR codes to postcards covers the placement and size that survive a real scan.
| Format | Best variable to test | How to tell the cells apart | Starting price |
|---|---|---|---|
| Postcards | The offer, and the headline on the address side. | Two QR codes or two promo codes, one per version. | $16.48 |
| Flyers | The lead image against a headline-only layout. | Separate short URLs printed on each version. | $39.54 |
| Brochures | Panel order, and where the call to action sits. | Distinct phone extensions inside each fold. | $57.11 |
| Business cards | What the back panel says, if it says anything. | Give each version to a different rep or event. | $17.57 |
Read the last column with the sample size problem in mind. Two cells means two print runs, and a small quantity per cell raises the unit price on both. That trade is the real cost of an offline test, and the cost per piece breakdown shows how it moves as quantity changes. The audience half matters just as much, so if the list is bought rather than built, read how to build or rent a mailing list before splitting anything.
Timing is the other adjustment. Count from the delivery window rather than the drop date, and hold the result for three to four weeks, because replies to mail trickle in long after the first wave. A campaign structure that supports testing from the start is laid out in our postcard campaign guide, and the channel comparison in direct mail versus digital marketing is worth reading before you decide where to spend the test budget.
What to Test First, and What to Leave Alone

There is a rough order of impact, and following it means your early tests produce results big enough to actually read.
- The audience. The same piece sent to a better matched list outperforms almost any creative change. This is the highest leverage variable and the one most often treated as fixed.
- The offer. What someone gets and what it costs them. Free consultation against 20 percent off. A deadline against no deadline. Offers move behavior in ways that fonts do not.
- The headline and the first line. Most people read this and nothing else, so it carries more weight than the rest of the copy combined.
- The call to action. Not the color of it, the instruction. "Call for a quote" and "Text a photo of your roof" ask for very different levels of commitment.
- The format. Postcard against letter, flyer against brochure. A format change alters cost, delivery, and attention all at once, which makes it a package test rather than a clean variable, and it is still usually worth running.
Leave the small cosmetic work for later, or for never. Typeface, button shade, and image crop can matter, but the effect is normally small enough that you need traffic most businesses do not have to detect it, and the test will burn weeks either way. The honest version of that advice: if you cannot describe the change in a sentence a customer would notice, do not spend a test on it.
One more thing worth testing that almost nobody does: send time. Same piece, same list, split by delivery week. It costs nothing extra in design and it often moves response more than the creative argument you were about to have.
Reading the Result Without Fooling Yourself

Tests do not usually fail by producing a wrong number. They fail because a real number gets read badly. These are the four that catch people most often.
| Mistake | What it looks like | Why the result is wrong | The fix |
|---|---|---|---|
| Peeking | Checking daily and stopping when B pulls ahead. | In a close race one side leads most of the time by chance, so early stops favor noise. | Set the sample size and end date first, then do not look at the winner until it arrives. |
| Slicing after the fact | B lost overall but won among customers in one state, so B wins. | Cut the data enough ways and some subgroup wins by luck alone. | Name any segment you care about before the test, and treat post hoc splits as a new hypothesis. |
| Novelty effect | A new layout spikes in week one, then settles back. | Regular visitors respond to the change itself, not to the design being better. | Run past the first week and check whether the gap holds for repeat audiences. |
| Contaminated split | Version A ran Monday to Wednesday, version B Thursday to Saturday. | The versions differ, but so does the day, so the two causes cannot be separated. | Run both cells in parallel over the same window, always. |
When a result survives all four, write it down somewhere permanent: the hypothesis, the numbers in each cell, the dates, and the decision. Six months later nobody remembers whether the free shipping test won, and an undocumented win gets retested by the next person who joins.
Then apply the winner and start the next test from it. That is the part that compounds. A single test is a fact about one campaign, but a sequence of tests that each start from the last winner is a slow, reliable climb, and it beats redesigning everything once a year on instinct. The counterpoint that keeps you honest is in the direct mail statistics roundup, which shows how wide real response rates range by industry, so you can judge whether your result is normal or remarkable.
Wally explains the A/B test
Two cards, one difference, two tally marks
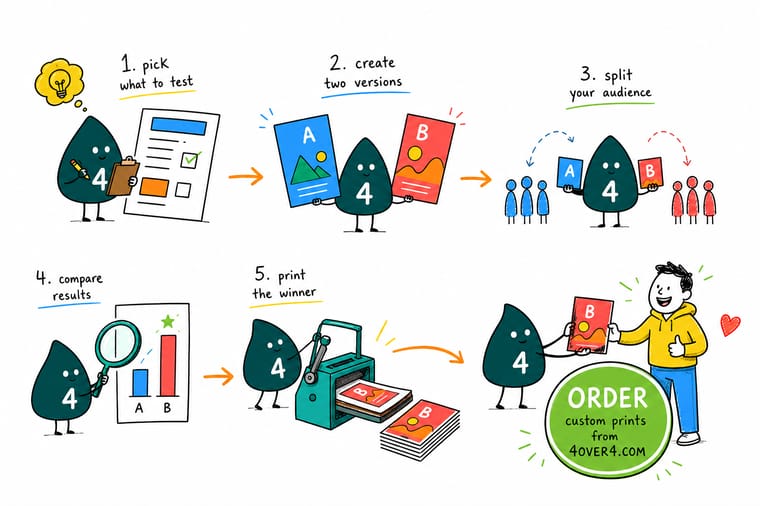
Wally shuffles the list and deals it into two even piles. Pile A gets the current offer. Pile B gets the new one, and nothing else changes, not the paper, not the picture, not the day it drops. Each card carries its own QR code so the replies land in separate buckets. When the count he decided on arrives, he reads it once and keeps the winner. If he had changed the offer and the picture together, he would be holding a winning card and no idea which half won it.
Print your two postcard versions →Specs and pricing
Formats that split cleanly into two cells
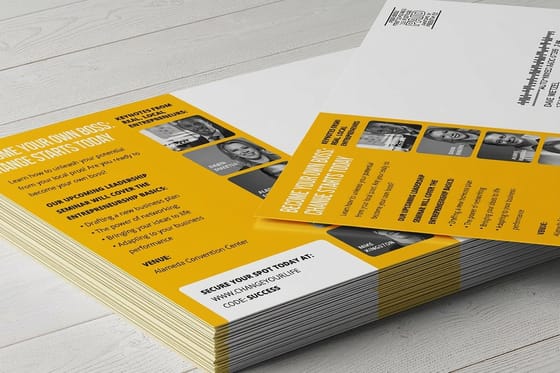
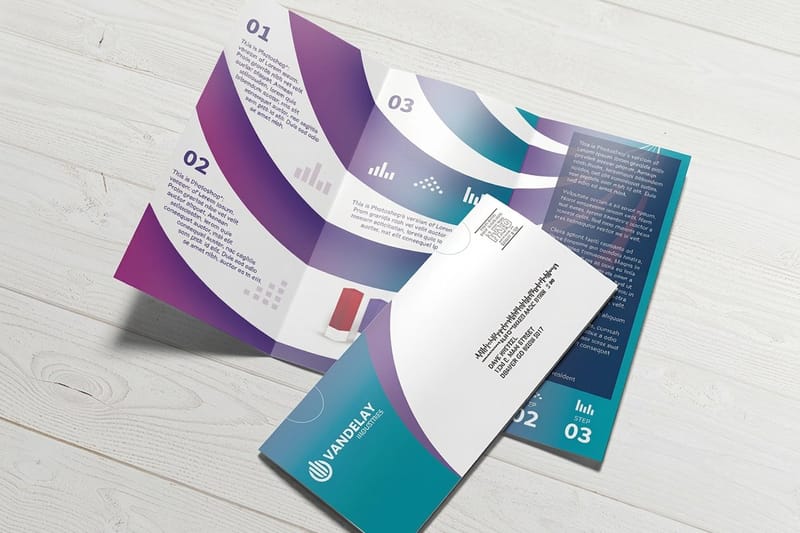
Sizes, stocks and quantities for the three formats most often used in an offline split test, with live starting prices from the 4OVER4.COM configurator.



Print it
Print both versions and let the response decide



Explore more
Where to go next



By the numbers
The print partner behind the test
Common Questions
Your A/B testing questions, answered
What is A/B testing in simple terms?
You make two versions of one thing, change exactly one element between them, show each version to a random half of the same audience, and count which half took the action you care about. That is the whole method. The randomness is what makes it work: because nothing else separates the two groups, any difference in response has only one candidate explanation, the element you changed.
How long should an A/B test run?
Long enough to collect the number of responses you decided on before the test started, and never shorter. For a website, that usually means running through at least one full week so weekday and weekend behavior are both included, because traffic on a Tuesday behaves differently from traffic on a Saturday. For a printed mail drop, count from the delivery window rather than the mail date, and give it three to four weeks before you read anything, since replies keep arriving well after the first few days.
How many people do I need for an A/B test?
More than feels necessary. The smaller the improvement you are hunting, the more responses you need to see it above the noise. A test that produces twelve replies on one side and sixteen on the other has not found a thirty percent lift, it has found four people. A practical filter: if the number of responses you expect in each cell would fit on a single sheet of paper, the test cannot separate a real effect from chance, so test something bolder or wait for a bigger list.
Can I test more than one change at a time?
You can, but then you are testing a package, not a variable. That is a legitimate choice when you are comparing a whole new concept against the current one and you only want to know which to run, and it is the wrong choice when you want to learn why. Multivariate testing separates several elements at once, though it splits the audience into many more cells and needs far more traffic than most small businesses have. Start with one variable at a time.
What does statistical significance actually mean?
It is a statement about luck, not about business value. A significant result means the gap between the two versions is unlikely to have appeared by chance alone if the versions were truly identical in effect. It does not mean the gap is large, that it will hold next quarter, or that it is worth acting on. A significant one percent lift on a tiny revenue line is still a rounding error, and an insignificant result on a promising idea is often just an underpowered test.
How do you A/B test a printed piece?
Split the mailing list at random into two equal cells, print two versions that differ in exactly one element, and give each version its own response path so the replies can be told apart. A unique phone extension, a distinct landing page URL, a per version QR code, or a printed promo code all work, and the QR route is the easiest to count. Postcards start at $16.48 at 4OVER4.COM, so a two version test on a modest list stays affordable, and the tracking work matters more than the print cost.
What if the test comes back a tie?
A tie is a real answer and often a useful one. It means the change you tested does not move the metric you chose, which frees you to pick whichever version is cheaper, faster, or easier to produce and stop debating it. Before you file it away, check that the test had enough responses to detect a difference worth caring about, because a tie from an underpowered test is not evidence of no effect, it is an absence of evidence.
Get Started
Ready to put a test in the mail?
Print two versions of the same postcard, give each one its own QR code, and split the list down the middle. We turn both cells around on the same schedule so the drop dates match.
Legal Disclaimer
Gold Standard guarantees apply to all standard orders placed through 4over4.com. Price match requires verifiable proof of a competitor's published price for an equivalent product with matching specifications and turnaround time. Satisfaction guarantee covers manufacturing defects and print quality issues. Contact support with order number and documentation. On-time delivery rate based on tracked orders 1999 to 2026. Individual results may vary based on shipping carrier performance.
