
Best Infographic Examples for Business


Marcus is our print marketing voice, built from the knowledge of our production team, with over 20 years in printing.
What Separates a Great Business Infographic From Noise
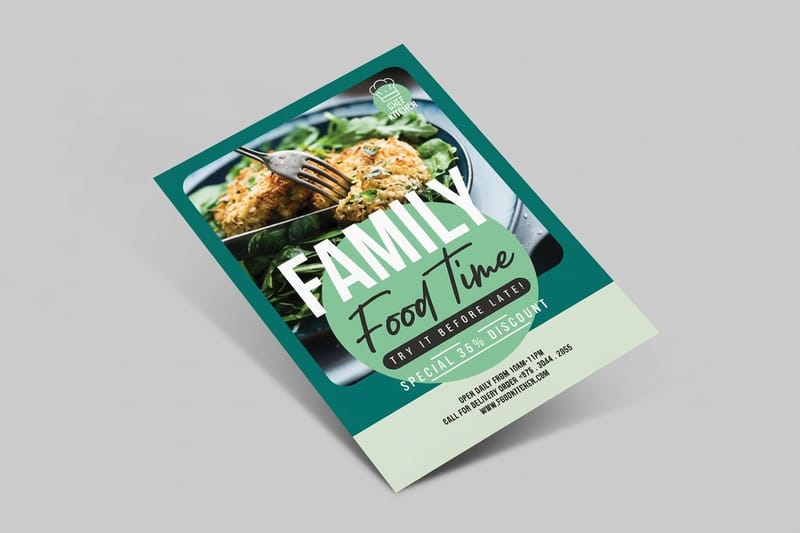
Most business infographics fail for one reason: they try to say everything at once. A wall of icons, six fonts, a rainbow of color, and no clear answer to the single question the reader actually had. The examples people remember do the opposite. They pick one idea, back it with two or three numbers, and walk your eye through the story in a straight line. In print, that one idea lives on a poster for the lobby, a business flyer for the handout table or a banner for the booth wall.
This guide breaks down what the best-in-class business infographics get right, sorts them by the job they do, and then covers the part most articles skip entirely: what happens after the design is finished. A screen-sized graphic is only half the value. The other half shows up when you print it as a poster for the lobby or a flyer for the trade show table, where it works on people who will never open your slide deck.
4OVER4.COM has printed 10 billion+ products for 150,000+ businesses since 1999, and printed data pieces, from conference posters to one-page handouts, are some of the most repeat-ordered work we run. So every example below comes with the print angle built in, not bolted on at the end.
The 7 Design Principles Behind Every Great Infographic
Strip away the styles and the software, and the infographics that get shared, saved, and pinned to a wall all obey the same seven rules. Learn these once and you can judge any example on sight, including your own draft: print it at 8.5" x 11" on the office printer, hold it at arm's length, and check each rule against the sheet rather than the screen.
1. Clarity beats cleverness
A reader should understand the point in about five seconds, before they read a single label. If your headline stat is buried under decoration, the design is working against you. Lead with the number that matters and let the rest support it.
2. Visual hierarchy guides the eye
Size, weight, and position tell people where to look first. The biggest element should be the most important one, not the prettiest one. Good infographics have an obvious entry point and a clear path from top to bottom.
3. Simplicity is a feature, not a compromise
Every element you remove makes the ones that remain louder. Cut the drop shadows, the third chart, and the stock icon that adds nothing. If a piece of data does not change the reader's mind, it is padding.
4. One story per graphic
The strongest examples answer exactly one question. "Why did our churn drop?" or "Where does the marketing budget go?" When a graphic tries to cover three questions, it usually answers none. Split it into three.
5. Color with a job, not a mood
Use two or three colors and give each one meaning. One brand color, one accent for the number you want people to remember, and a neutral for everything else. A gradient rainbow feels designed but reads as chaos.
6. Honest data, honest scale
Truncated axes, mismatched circle sizes, and 3D pie charts that distort proportions all erode trust. The best business infographics are persuasive because the numbers are shown straight, not because the chart was tortured into a better story.
7. A takeaway you can say out loud
End with one sentence a reader could repeat to a colleague from memory. If they cannot summarize your graphic in a breath, it has no takeaway, and a takeaway is the whole point.
Print picks
Three ways to print your infographic
Live prices, ready to hold your data at wall size, handout size, or desk size.
 Business Banners $43.92 each Blow the same graphic up to wall size so a room reads it from across the floor.
 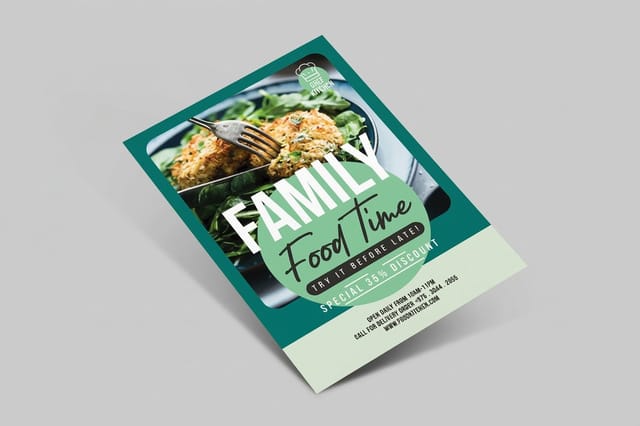 Business Flyers 50 for $57.11 Turn your infographic into a double-sided handout people take home from the booth.
  Business Card Magnets 25 for $19.68 Shrink the key stat to a magnet that stays on the office fridge for months. Business Flyers From $57.11 Turn one of these layouts into a flyer people take home.
 Infographic Examples by Type, and When to Use Each
"Infographic" covers a dozen different formats, and picking the right one decides most of the design. Match the shape to the data and to the print size: a statistical graphic reads on an 8.5" x 11" flyer, a timeline wants the width of a 2' x 6' banner, and a process graphic fits an 11" x 17" poster. Here are the seven types worth knowing, with the business situation each one owns.
Statistical infographics
Big numbers, minimal words. These are the staple of business reporting: one screen, three or four headline stats, each with a short label and an icon. See a clean real-world example in this small business data infographic, which turns a pile of survey results into something a founder can absorb in a glance.
Informational infographics
Text-forward pieces that explain a concept in ordered sections. Think "5 factors that affect X," each with a heading, an icon, and a sentence. They read like a well-designed one-pager and pair naturally with longer print collateral such as company brochures.
Timeline infographics
A vertical or horizontal line with dated milestones. Perfect for company histories, product roadmaps, and "how we got here" slides that need to survive being printed and pinned up in a hallway.
Process and how-it-works infographics
Numbered steps with arrows, showing a workflow or a customer journey. When onboarding a new hire or explaining a service, a process graphic beats a paragraph because the reader can see the shape of the whole thing at once.
Comparison infographics
Two or three options side by side, usually as columns. Sales teams live on these. The trick is to keep the rows identical across columns so the differences do the talking, the same discipline you see in a strong design portfolio layout.
Geographic and map infographics
Data plotted onto a map: store locations, regional sales, delivery zones. They only work when the geography is the point, so resist the urge to force a map onto data that has nothing to do with place.
Hierarchical infographics
Pyramids and tiers that rank things by importance or volume, from Maslow-style pyramids to a sales funnel. They make structure obvious, which is exactly why funnels and org relationships get drawn this way.
Quantity and price
Business flyer pricing and specs
Real configurator numbers. The more handouts you print, the lower the per-piece cost drops.
| Quantity | Price Per Unit | Total |
|---|---|---|
| 50 | $1.14 | $57.11 |
| 100 | 82.4¢ | $82.38 |
| 200 | 53.3¢ | $106.55 |
| 300 | 41.0¢ | $123.02 |
| 400 | 34.9¢ | $139.49 |
| 500 | 31.2¢ | $155.97 |
Print It Big: Turning a Screen Infographic Into a Poster or Handout

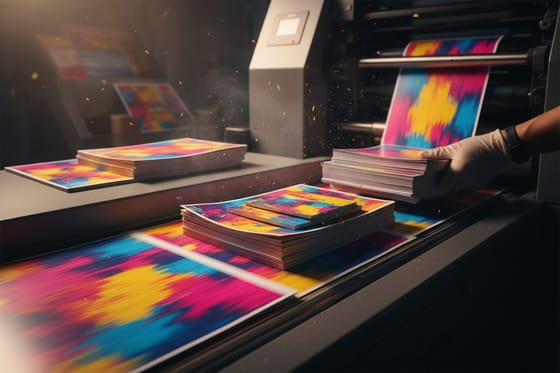
Most guides stop at the design; the return starts when you print it. A brilliant infographic that only lives on a webpage reaches the people already looking. The same graphic printed and placed in the physical world reaches everyone who walks past it, and that audience does not scroll away.
Blow it up as a large-format business banner for a booth wall or a lobby, where a room can read your headline number from across the floor. Hand out the compact version as a double-sided business flyer so the data leaves with the reader. For a single hero stat, print a business card magnet that ends up on a fridge or a filing cabinet, seen a hundred more times than any post.
Two things make print land. First, design at print resolution from the start, since a graphic built for a 1080-pixel screen turns soft at poster size. Start from a print-ready layout in the design templates library so your artwork sits inside the cut and bleed lines automatically. Second, plan the timing: 4OVER4.COM Same Day Printing produces and ships qualifying orders the same day for a last-minute event, and the Green Printing program keeps a wall of posters easy on the planet.
Large format
Business banners for wall-size data
Take the headline number poster-size for a booth, a lobby, or a conference stage.

Where a Printed Infographic Earns Its Keep
The digital and printed versions cover different ground. Once a graphic is designed well, printing it reaches moments a screen cannot, and the print costs little: a business banner starts at $43.92 at 2' x 6' and prints in 2 business days, business flyers print from 50 copies in 3, and a business card magnet carrying one hero stat starts at $19.68 for 25.
- Trade shows and expos. A banner-sized stat pulls people to your booth from two aisles away, and a flyer sends the numbers home in their bag.
- Lobbies and offices. A framed process or timeline graphic educates every visitor and reminds the team what the goal is.
- Onboarding. A one-page process infographic handed to a new hire beats a 40-slide deck they will never reopen.
- Sales leave-behinds. A comparison graphic left on the table keeps making your case after the meeting ends.
- Investor and board reports. A crisp statistical print piece signals that you respect the reader's time and know your numbers cold.
From Data to Design to Doorway
The workflow that produces a great business infographic is short and repeatable. Start with the single question you want to answer. Gather the two or three numbers that answer it honestly. Apply the seven principles above so the design carries the point without decoration. Then decide where it needs to live, and print it for that place.
That last step is the one that separates a graphic that gets a few likes from one that shapes how people see your business in a room. Pick the format that fits the moment, whether that is a banner, a flyer, or a magnet, and let a piece you already made keep working long after the screen goes dark.
Keep reading
Related design and print reads
From layout inspiration to the tools that build print-ready artwork, here is where to go next.

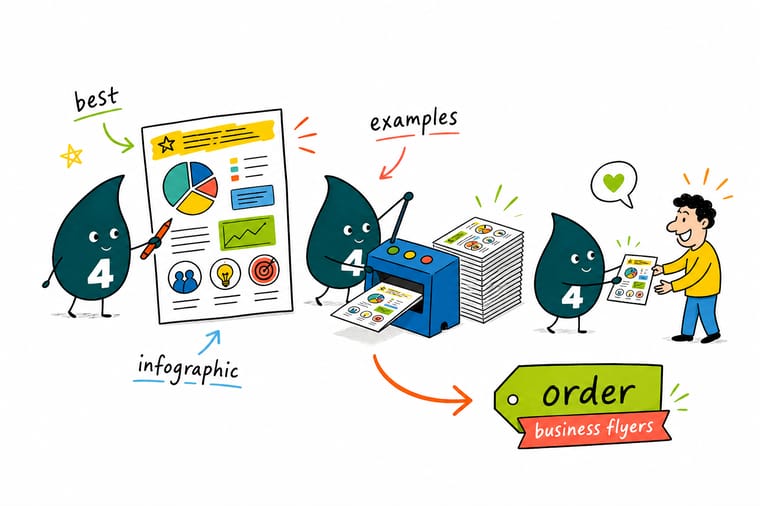
Wally turns your data into something people actually read
Design it clean, then print it where it counts
A great business infographic answers one question with two or three honest numbers, uses two or three purposeful colors, and ends with a takeaway you can say out loud. Once it looks that good on screen, do not stop there. Print it as a large-format banner for the wall, a flyer for the handout table, or a magnet for the desk, and 4OVER4.COM produces it sharp so the data reads clean from across the room.
Print your infographic big →What makes an infographic worth sharing
Explore more
More ways to design and print for business
Open the banner and flyer products to price the print, the small business data infographic for a finished example, and the brochure examples for data that needs more than one page.
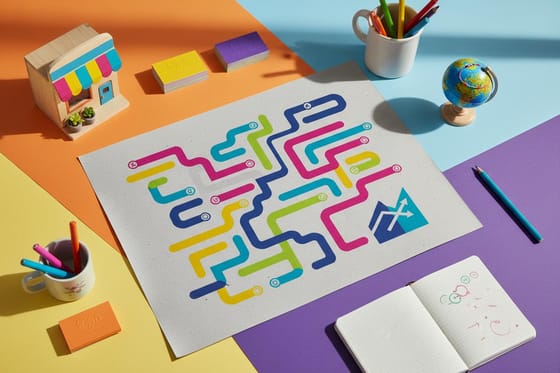 Statistics Small Business Data Infographic A live example: key small-business stats, laid out clean. Product Business Flyers Print your infographic as a handout, from $57.11. Product Business Banners Blow the graphic up to wall size, from $43.92.
  Alternative 4OVER4 vs MOO NFC Cards How the two stack up for modern business cards.
 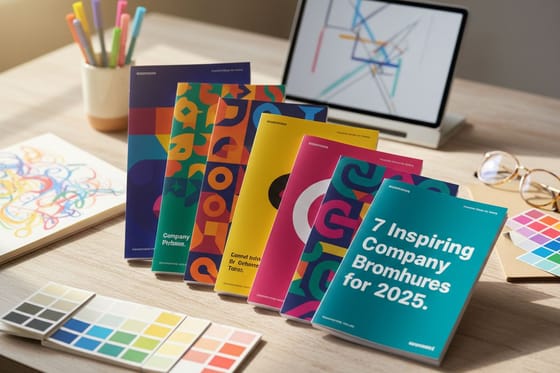 Article Company Brochure Examples Print collateral that pairs with your data pieces.
 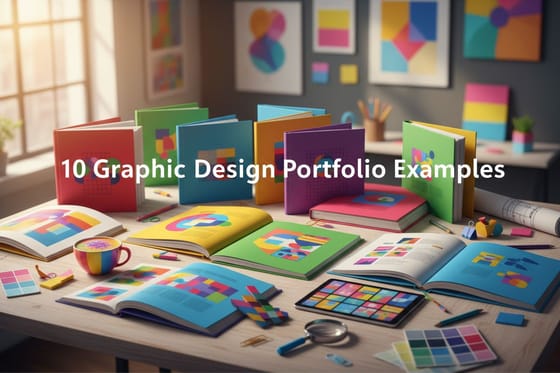 Article Graphic Design Portfolio Examples Present visual work that wins clients.
  Article Amazing Business Card Designs Design inspiration you can carry into any print piece.
 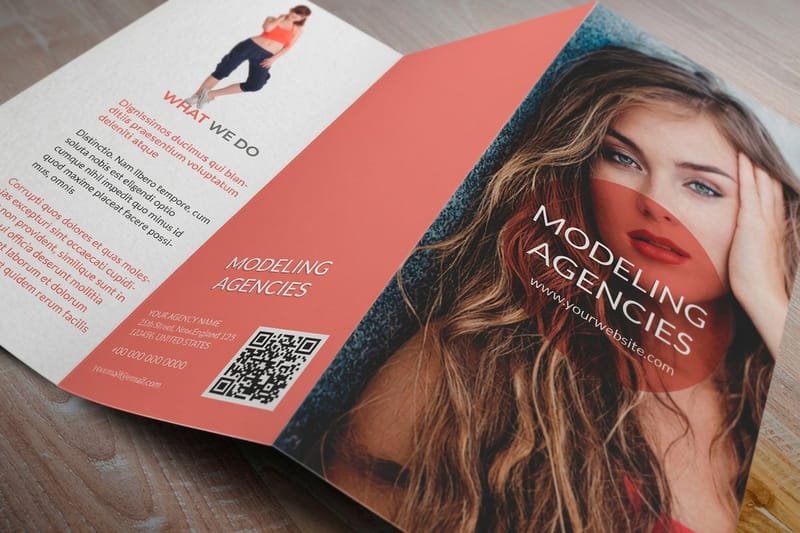 Guides All Printing Guides Practical how-tos across every product we print.
 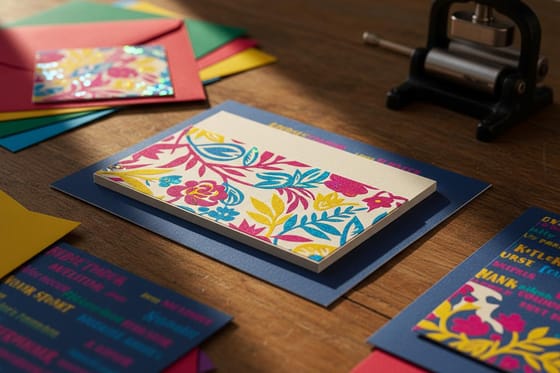 Service Tip-On Printing Adhere a card or sample onto the front of a print piece.
  Benefit Same Day Printing Order today, ship today when the event is tomorrow.
 Take your best graphic off the screen and into the room
Take your best business infographic off the screen and into the room. Print it as a banner, a flyer, or a magnet, and 4OVER4.COM produces it sharp, as fast as same day.
Infographic questions teams keep running into
What are the 7 key components of infographic design?
The seven traits shared by strong business infographics are clarity (the point reads in about five seconds), visual hierarchy (size and position guide the eye), simplicity (every removable element is removed), one story per graphic, purposeful color (two or three colors with meaning), honest data and scale, and a single takeaway a reader can repeat from memory. Nail these and the design almost handles itself. For layout inspiration that follows the same discipline, see these graphic design portfolio examples.
What are the main types of infographics, with examples?
The seven most useful business types are statistical (big numbers, minimal words), informational (ordered explainer sections), timeline (dated milestones), process (numbered steps and workflows), comparison (options side by side), geographic (data on a map), and hierarchical (pyramids and funnels). A clean statistical example is this small business data infographic. Pick the type that matches your data, not the one that looks the fanciest.
What are the best infographic examples for business?
The best examples all pick one question and answer it with two or three honest numbers, then get out of the way. Statistical one-pagers work for reporting, process graphics shine in onboarding and sales, comparison graphics carry sales conversations, and timeline graphics tell a company story. The common thread is restraint. When you have a strong one, do not let it stay on a screen: print it as a banner, a flyer, or a magnet so it reaches people in the room.
Which layout fits the data I am showing?
Start from the job. If you are presenting survey results, use a statistical layout. If you are explaining a workflow, use a process graphic. If you are comparing plans, use columns. Then choose the print format by where it needs to live: a business banner for a booth wall or lobby, a business flyer for a handout, and a business card magnet for a single hero stat that stays on a desk. The data decides the layout, and the venue decides the print.
What does it cost to print an infographic as a poster or handout?
At 4OVER4.COM, business flyers start at $57.11, business banners at $43.92, and business card magnets at $19.68, so you can cover a wall display, a stack of handouts, and desk magnets without a big budget. Final price depends on size, material, finish, and quantity, and ordering more brings the per-piece cost down quickly. Check the exact configurator numbers on each product page before you check out.
