
Brand Loyalty Statistics Every Marketer Should Know in 2026


Retention, awareness, Gen Z loyalty, and employer branding, set against the order data behind 25 plus years of printing brand materials at 4OVER4, and tied to the business cards, postcards, flyers and thank-you cards a customer keeps.
Loyal customers are your most profitable customers. Retaining them costs 5 to 7 times less than winning new ones, repeat buyers spend 67 percent more, and consistent branding lifts revenue by up to 23 percent. With 150,000 plus businesses printing brand materials at 4OVER4.COM, the data backs up what marketers already feel: trust and consistency build loyalty that pays.
The short version
What brand loyalty statistics tell us about growth
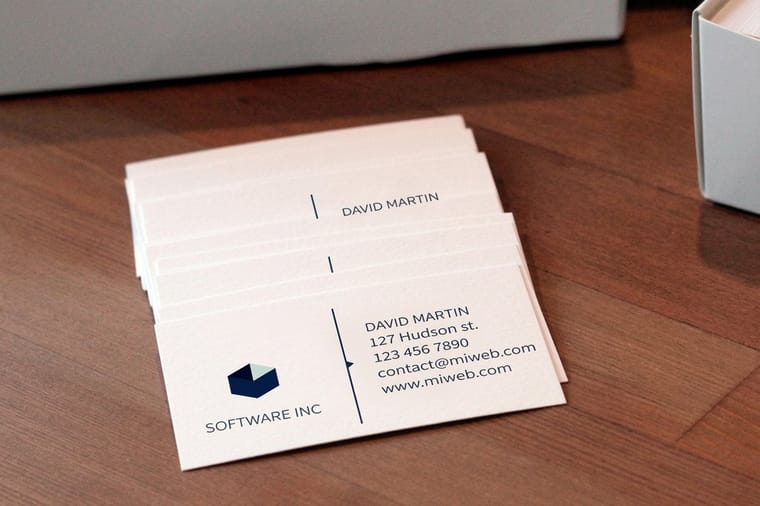
Customers who trust a brand spend more, return more often, and tell their friends: repeat buyers spend 67 percent more (BIA/Kelsey), and a loyal customer is worth 10 times their first purchase (White House Office of Consumer Affairs). For a business of any size, that makes loyalty the engine behind predictable revenue and lower acquisition costs. In print, loyalty lives on the pieces a customer keeps: business cards in a wallet, postcards on a fridge door, flyers tucked into an order. Employer branding statistics show the same force at work internally, because people stick with brands they believe in, as employees and as customers. If you are building a business, our Small Business Statistics put loyalty in the bigger picture.
Why it matters
Why brand loyalty data matters more than ever
Read these numbers as a roadmap for where your marketing dollars go, how you keep customers, and what separates businesses that thrive from those that do not. Bain and Company found that raising customer retention by 5 percent can lift profits by 25 to 95 percent, the difference between growth and stagnation. On a print budget, that moves money toward the pieces existing customers receive, the thank-you card in the box and the postcard that brings them back, before a new run aimed at strangers.
For context on how these loyalty trends connect to broader business performance, explore our Small Business Growth data. And if you are curious about how marketing spend drives retention, our Small Business Marketing Statistics break it down further. The data is clear. Loyal customers are your most profitable customers.
These numbers matter whether you are running a startup or managing a team of hundreds. The sections below break down every angle, from retention economics and brand awareness to generational loyalty, employer branding, and the role of physical touchpoints in building trust.

By the numbers
Four loyalty figures worth a print budget
Four figures carry most budget arguments for loyalty: retention costs 5 to 7 times less than acquisition (Harvard Business Review), repeat buyers spend 67 percent more (BIA/Kelsey), consistent presentation lifts revenue by up to 23 percent (Lucidpress), and color raises recognition by up to 80 percent (University of Loyola). All four come from industry research, and our own production data follows further down the page. Set those benchmarks against 25 plus years of printing brand materials at 4OVER4.COM and the picture is consistent: the brands people can see and hold are the ones they come back to.
Retention, awareness and trust
The numbers behind customer loyalty, awareness, and retention
Seven categories follow, each figure with the study behind it: retention economics, brand awareness, Gen Z loyalty, employer branding, loyalty programs, physical branding, and trust. The sources run from Harvard Business Review and McKinsey to Colloquy, whose count of 16.7 loyalty programs per American shows how crowded the field has become. 4OVER4.COM has worked with 150,000 plus businesses on brand materials, and the patterns in the data are consistent year after year.
Customer retention economics
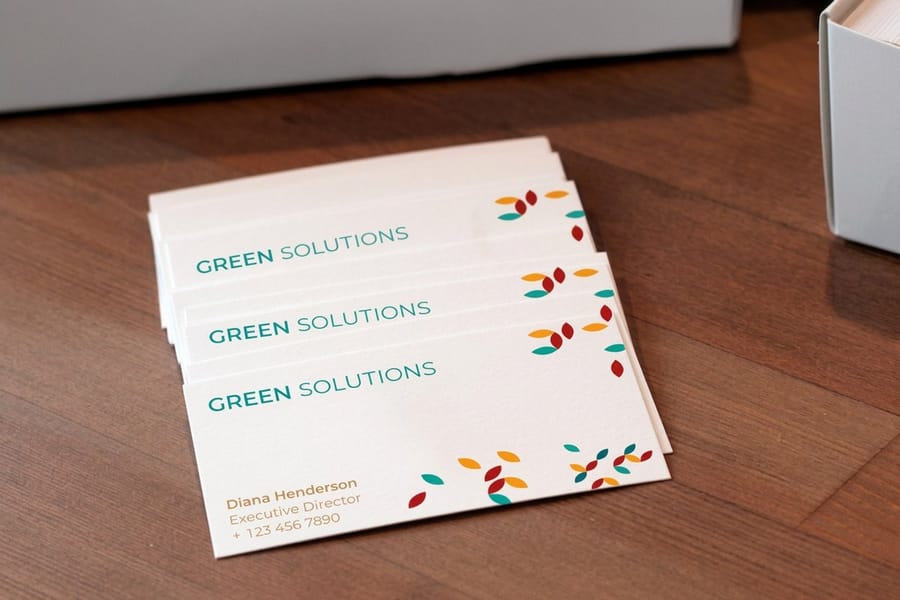
Acquiring a new customer costs 5 to 7 times more than retaining an existing one, according to research published by the Harvard Business Review. That ratio alone explains why smart businesses obsess over loyalty. It is cheaper, it is more predictable, and it compounds over time.
Repeat customers spend 67 percent more on average than first-time buyers, based on data from BIA/Kelsey. Your existing customers are not just coming back, they are spending far more each time they do. This is why understanding your Small Business Failure Rate data matters, because businesses that fail often underinvest in retention.
The probability of selling to an existing customer sits between 60 and 70 percent, while the probability of selling to a new prospect is just 5 to 20 percent, per Marketing Metrics. The math is brutal if you chase only new leads.
We stopped pouring everything into acquisition and shifted 40 percent of our budget to retention. Revenue went up 30 percent in six months. Loyal customers do the heavy lifting.
Rachel K., E-commerce Brand Manager
Brand awareness and recognition
Brand awareness statistics show that consistent presentation across every platform increases revenue by up to 23 percent, according to Lucidpress. That is not about having a pretty logo. It is about showing up the same way every single time, on your website, your packaging, your business cards, and your signage.
Brand recognition statistics tell us it takes 5 to 7 impressions before someone remembers your brand, based on the Marketing Rule of 7. Physical materials like printed cards, postcards, and branded packaging count as durable impressions because they are tangible. People hold them. They sit on desks. They get pinned to boards.
Color increases brand recognition by up to 80 percent, according to research from the University of Loyola. This is why consistent color usage across print and digital matters. Your brand colors on a thick, well-printed business card create a different impression than a pixelated social ad.
Gen Z brand loyalty, a different playbook
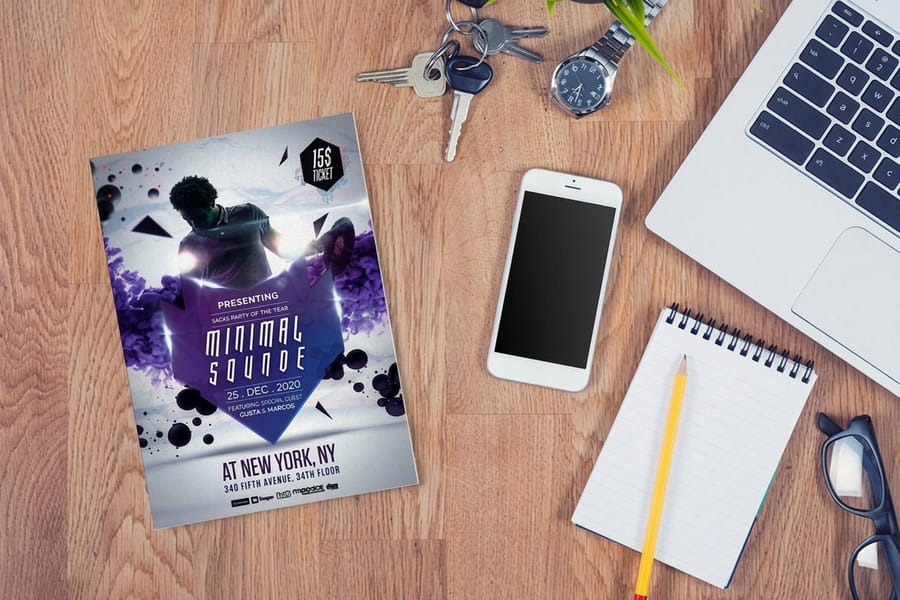
Gen Z brand loyalty statistics challenge assumptions. According to a 2024 report from McKinsey, 65 percent of Gen Z consumers say they are loyal to brands that align with their values. Price matters, but purpose matters more to this generation.
Here is where it gets interesting. According to Edelman's Trust Barometer, 73 percent of Gen Z will pay more for products from brands they trust. That is a willingness to choose values over savings. For Startup Statistics that track generational spending, this shift is a goldmine.
Gen Z also responds strongly to tangible brand experiences. Despite being digital natives, 72 percent of young consumers say they notice and appreciate physical mail and printed materials, per a USPS study. The tactile experience creates a trust signal that digital ads cannot replicate.
Our Gen Z customers respond to handwritten thank-you cards more than any email campaign we have ever run. The physical touchpoint builds real connection.
Marcus D., DTC Brand Founder
Employer branding and internal loyalty
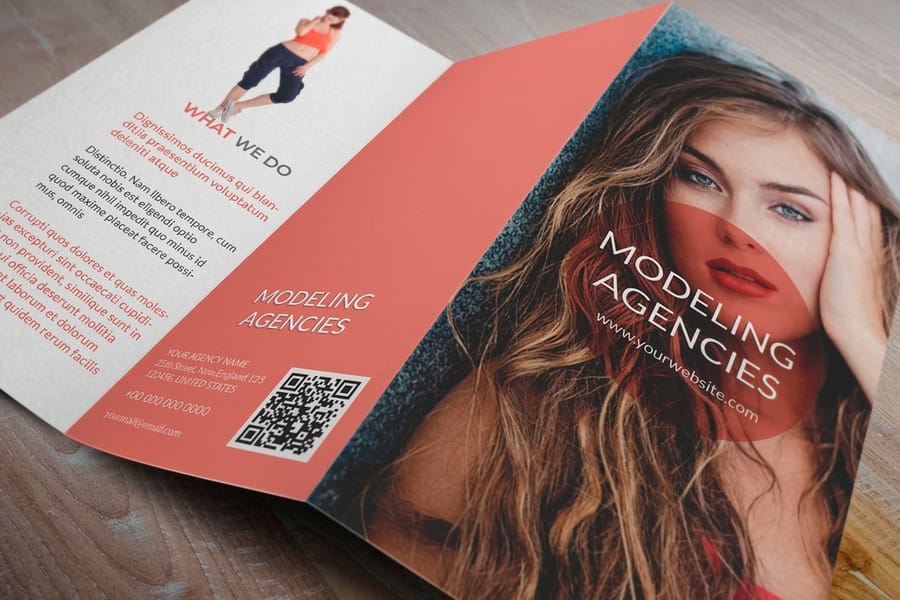
Employer branding statistics mirror customer loyalty data in surprising ways. According to LinkedIn, companies with strong employer brands see a 50 percent reduction in cost-per-hire. Loyalty works both ways, and when employees believe in the brand, they stay longer and perform better.
Glassdoor research shows that 75 percent of job seekers consider an employer's brand before even applying. Your brand reputation is not just customer-facing. It is how you attract and keep talent. Branded onboarding materials, quality business cards for new hires, and a consistent visual identity across internal communications all contribute to this.
Businesses that invest in employer branding see 28 percent lower turnover, according to LinkedIn's Global Talent Trends report. When your team feels proud of the brand they represent, they become your most effective loyalty builders. Every employee interaction with a customer is a brand moment.
Loyalty programs and their impact
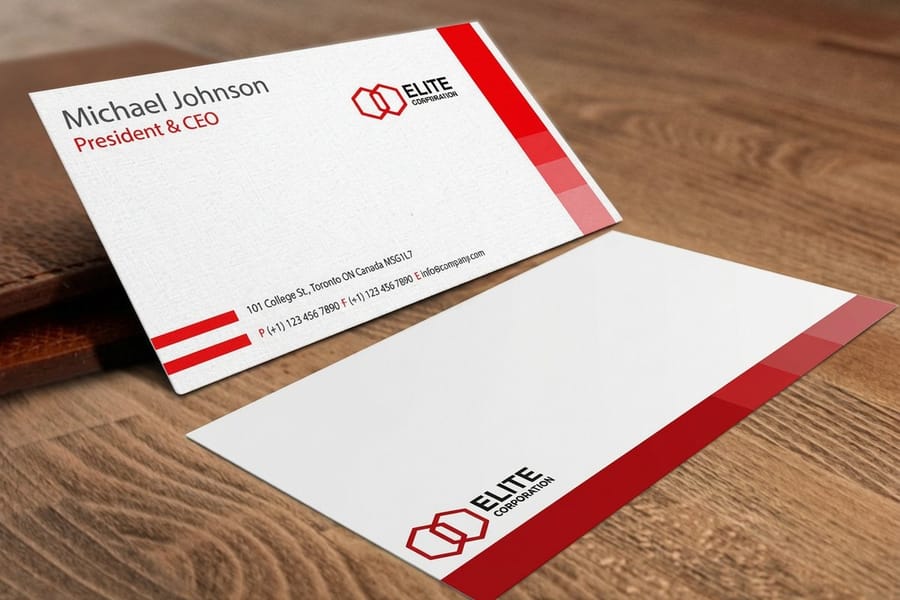
According to Bond Brand Loyalty's 2024 report, 79 percent of consumers say loyalty programs make them more likely to continue doing business with a brand. But here is the catch. Only 44 percent of loyalty program members are satisfied with their experience. There is a massive gap between offering a program and running one well.
The average American belongs to 16.7 loyalty programs but actively uses only about 7, per Colloquy research. That means nearly 60 percent of loyalty memberships are dormant. The brands that win are not just signing people up. They are creating reasons to come back.
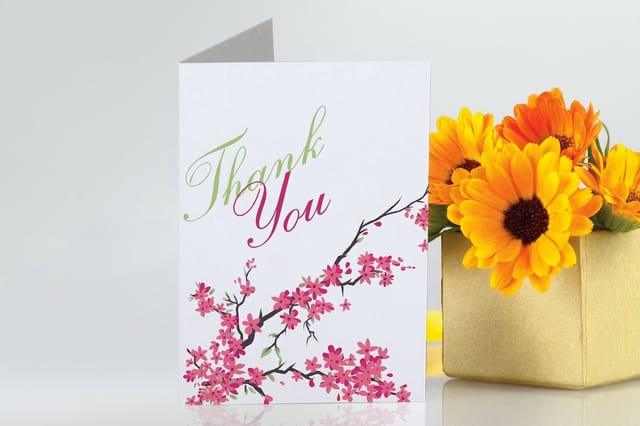
Understanding your Small Business Marketing Budget allocation is key here. Loyalty programs do not need to be expensive, but they do need to be intentional. Even something as simple as a branded thank-you card with a discount code can drive repeat purchases.
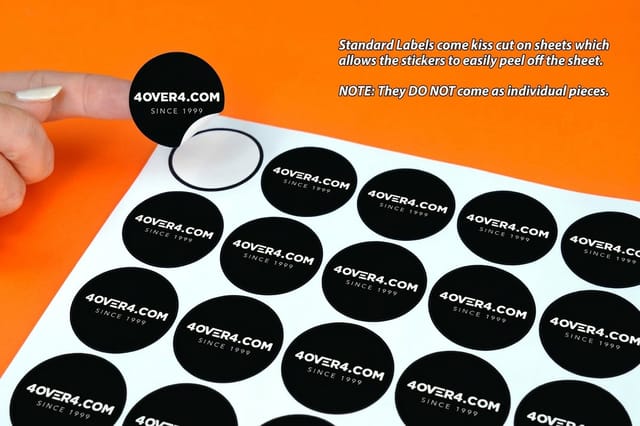
We added a handwritten note and a branded sticker to every order. Return customer rate jumped from 22 percent to 38 percent in one quarter. Tangible touches matter.
Priya S., Small Business Owner
The role of physical branding in building loyalty
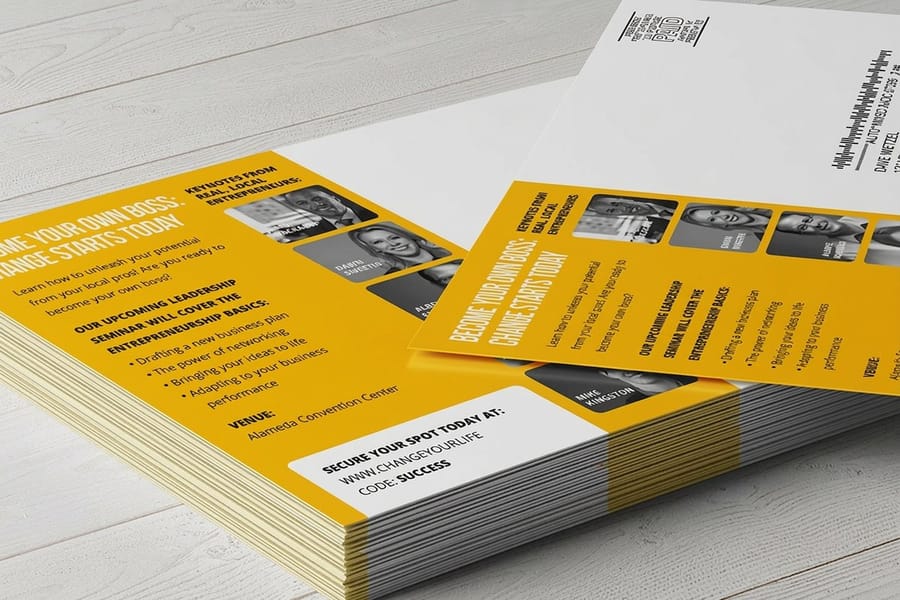
Branding statistics consistently show that physical touchpoints outperform digital-only strategies for building trust. According to a Sappi study, 70 percent of consumers say printed materials make a brand feel more trustworthy than digital-only communications.
Neuroscience research from Temple University found that physical materials produce more emotional processing and are better remembered than digital content. When someone holds your business card or opens a branded package, their brain processes it differently than scrolling past an ad.
Direct mail achieves a 9 percent response rate for house lists, compared to email's average of 1 percent, according to the Data and Marketing Association. That is not a small difference. For businesses serious about brand loyalty, physical print materials are a competitive advantage.
Trust, consistency, and long-term value
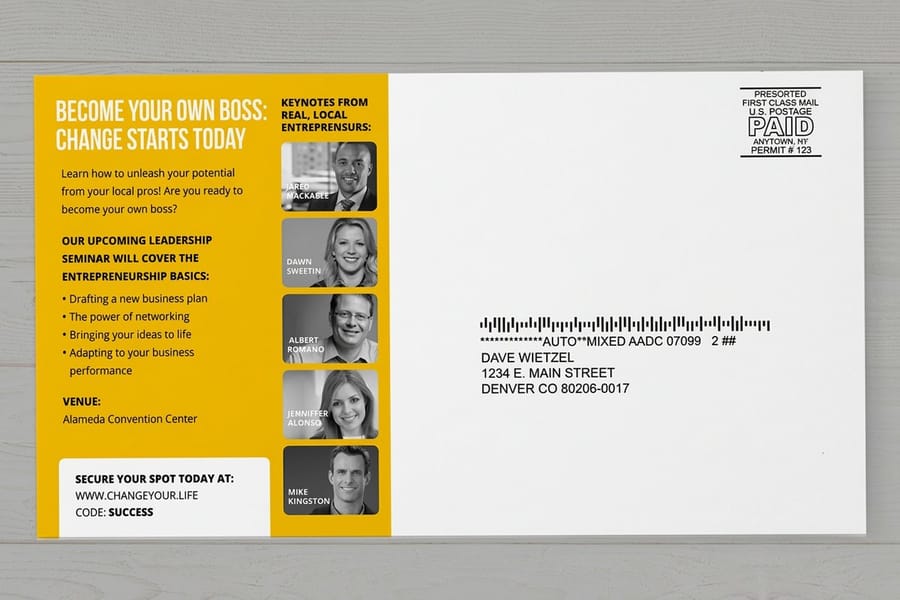
According to Edelman's 2024 Trust Barometer, 81 percent of consumers say they need to trust a brand before they will buy from it. Trust is not built overnight. It is built through consistent, reliable brand experiences across every touchpoint.
The lifetime value of a loyal customer is 10 times the value of their first purchase, according to the White House Office of Consumer Affairs. That single statistic should reshape how you think about every customer interaction. The first sale is just the beginning.
4OVER4.COM has seen this firsthand across 150,000 plus businesses that use print materials to build brand consistency. From business cards to packaging inserts to branded stationery, every printed piece is a loyalty-building opportunity.
Make it relevant
Consistency is what turns awareness into loyalty
Awareness gets you noticed, and consistency keeps you remembered. The Marketing Rule of 7 puts recognition at 5 to 7 impressions, and each impression only counts if it looks like the last one. The strongest brands lock their colors, logo, and stock across every piece a customer touches, from the business card in their wallet to the packaging on their desk. In practice that means one set of CMYK color values, one logo position, and one stock family, for example 16pt gloss cover on both the business card and the postcard, so the two pieces feel like one brand in the hand.
Proof, not promises
What repeat brand orders show on stock and finish
These four numbers come from our side of the press, not from a survey: the reorder, review, and delivery records that round out the picture for marketers planning brand investments in 2026 and beyond. A 99 percent reorder rate is a loyalty signal in itself, and a 4.8 out of 5 rating across 10,000 plus reviews shows the print quality holds up piece after piece. A repeat order only works when the second run matches the first, so we print to G7 color profiling with multi-day accuracy tests, and a reorder of 16pt gloss or 14pt white linen cards prints to the same color targets as the first run.
Generations and channels
How loyalty metrics compare across generations and channels
Loyalty swings with the audience and the channel. Millennials sit near 50 percent brand loyalty, and a mailing to a house list draws around 9 percent response against about 1 percent for email. The two tables below set four generations and four touchpoints side by side. According to McKinsey and Sappi research, the pattern is consistent: values-aligned and physical experiences build the deepest loyalty.
| Generation | Where loyalty stands |
|---|---|
| Baby Boomers | Highest traditional brand loyalty at roughly 65 percent. |
| Millennials | Middle of the pack at about 50 percent brand loyalty. |
| Gen Z, traditional | Around 40 percent on legacy or habit-based loyalty. |
| Gen Z, values-aligned | Jumps to 65 percent when a brand matches their values. |
| Touchpoint | How it performs |
|---|---|
| Printed materials | Trust rating of 70 percent, recall near 75 percent after contact. |
| Direct mail | Response rate around 9 percent for house lists. |
| Digital advertising | Trust rating of 42 percent, recall closer to 44 percent. |
| Response rate around 1 percent on average. |
Multi-channel consistency wins. Baby Boomers show the highest traditional loyalty near 65 percent, while Gen Z sits closer to 40 percent unless values alignment is factored in, then it jumps back to 65 percent. Brands that combine digital presence with physical touchpoints build deeper loyalty than those relying on a single channel.
Wally turns the data into loyal customers
Statistics are step one. A brand people trust is step two.
The numbers all point the same way: a consistent, tangible brand beats a message lost in the noise. Wally's rule is simple. Keep your colors, logo, and stock the same on every piece, put your brand in people's hands, and let trust do the rest. Print carries a 70 percent trust rating against 42 percent for digital ads, so holding one color and one stock across every card is what the 23 percent revenue lift from consistency actually asks of you.
Order business cards →Side by side
How brand touchpoints stack up against each other
Set touchpoints against each other and the statistics start to earn their keep, because every dollar has to compete for the best return. The table below puts printed branding alongside direct mail, email, and digital advertising on four yardsticks: trust, response, cost, and trackability. A printed piece costs more per contact than an email and pays it back with a 70 percent trust rating and recall near 75 percent. Our direct mail comparison runs the same test on the mailbox against the inbox.
| Channel | Trust | Response and recall | Cost | Trackable |
|---|---|---|---|---|
| Printed branding | High, people hold and keep it | 75% recall, 70% trust | Higher per piece | Yes, with codes and QR |
| Direct mail | High, it lands on the desk | 9% response for house lists | Higher per piece | Yes |
| Lower, easy to ignore | Around 1% response, 44% recall | Very low per send | Yes | |
| Digital ads | Lower, banner blindness | 42% trust, low recall | Low cost per impression | Yes |
Print leads on trust, response rate, and memorability, and digital leads on speed and cost per impression, so plan for both. A branded card with a QR code that sends someone to a landing page carries the trust of print into a channel you can track. A thank-you card with a discount code does the same job for a loyalty program, and with the average American signed up to 16.7 programs (Colloquy), a card in the hand helps yours become one of the 7 they use.
For employer branding specifically, the same pattern holds. Companies with strong brands attract and keep talent more cheaply, and every employee interaction becomes a brand moment that reinforces loyalty on both sides of the relationship.
Myths vs facts
What marketers assume about loyalty, and what lasts
Four assumptions keep marketers from investing in loyalty the way the numbers reward: that Gen Z has no loyalty, that loyalty stops at the customer, that digital beats print on trust, and that a signup is enough. Each pair below sets the assumption against the study that answers it, from McKinsey on Gen Z values to Colloquy on dormant programs, so you can plan your next brand investment on evidence rather than habit.
Gen Z has no brand loyalty.
Traditional loyalty runs near 40 percent, but 65 percent of Gen Z stay loyal to brands that match their values and 73 percent will pay more for a brand they trust.
Loyalty is only about the customer.
Employer branding mirrors it. Strong employer brands see 50 percent lower hiring costs and 28 percent lower turnover, and loyal employees become better brand advocates.
Digital always beats print for building trust.
Printed materials earn a 70 percent trust rating versus 42 percent for digital ads, and physical pieces are processed with more emotion and remembered better.
Signing people up for a loyalty program is enough.
The average person belongs to 16.7 programs but actively uses about 7. Only 44 percent of members are satisfied, so the experience has to earn the return visit.
Stock, finishing and price
What a brand's first 100 cards cost, stock by stock
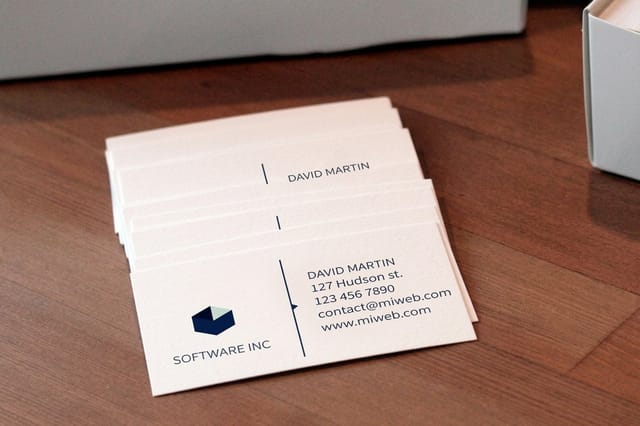
Business cards are the first loyalty touchpoint most brands put in a customer's hand, and once a look is locked, the reorders get cheaper per card: standard business cards run 500 for $36.26 and 1,000 for $65.91. The current pricing and full specifications below let you match the right stock and finish to your brand, from 16pt uncoated with soft touch to 14pt white linen or 18pt kraft cover made from 100 percent post-consumer waste.
Print it
The brand materials marketers reach for most
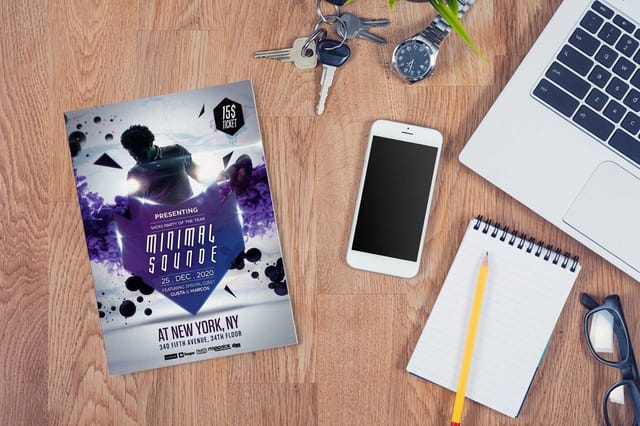
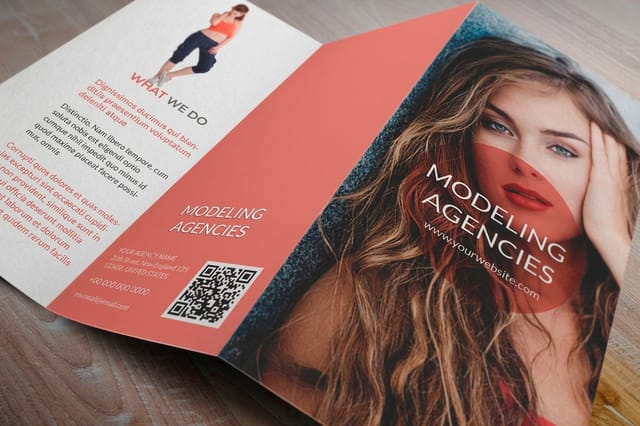
Consistency is a stock decision as much as a design one. Standard Business Cards print 100 for $17.57 in 3 business days, greeting cards 50 for $56.02, and postcards 50 for $16.48. These are the pieces marketers reorder to keep a brand recognizable.

What our print data reveals
What reorders reveal about brands that stay consistent
Third-party studies report what customers say. 4OVER4.COM's own records, drawn from 150,000 plus businesses ordering print from our NYC plant since 1999, show what they do: 99 percent of 4OVER4.COM customers will reorder. We read that as a loyalty signal as much as a satisfaction metric. When businesses find a print partner they trust, they stick around.
With 10,000 plus reviews and a 4.8 out of 5 star rating, our own brand loyalty data mirrors what the research says. Quality, consistency, and reliability create loyal customers. Businesses that reorder printed materials consistently, from business cards to packaging inserts to branded stationery, tend to grow faster than those that treat print as a one-time expense.
The same principle applies to their customers. Consistent, well made branded materials build the kind of trust that drives repeat purchases. Your brand\'s stock, finish, and print quality directly affect whether recipients keep a piece or toss it, and that difference is what separates hitting industry-average loyalty from beating it.
The quality of 4OVER4.COM's print made our brand feel premium before a prospect read a single word. Our repeat customer rate is the best we have seen in three years.
Verified customer, E-commerce Manager
How 4OVER4 helps
Turn loyalty data into real-world results
Brand loyalty statistics are only useful if you act on them. 4OVER4.COM gives businesses the tools to turn loyalty data into results. With 60 plus paper types, 1,000 plus products, and 99.8 percent on-time delivery, every printed piece arrives ready to make an impression. Start building brand recognition without a huge budget with free business cards so you can put your brand in people's hands right away. Every order is backed by our 5 Gold Guarantees, covering quality, price match, on-time delivery, customer service, and ultimate satisfaction. Physical branding builds trust, trust builds loyalty, and loyalty builds profit.
Why marketers trust us
The press behind the pieces a brand repeats
Our own record sits behind the benchmarks: brand materials printed since 1999 for 150,000 plus businesses, more than 10 billion business cards off the press, and a 4.8 out of 5 average across 10,000 plus reviews. Add 99.8 percent on-time delivery, with 82 percent of orders shipping early, and you can invest in your brand knowing the pieces will land sharp and on time.
How we built this
The research and reorder records behind these figures
Every statistic on this page comes from published research by recognized organizations including Bain and Company, Harvard Business Review, McKinsey, Edelman, LinkedIn, and the Data and Marketing Association. We cross-referenced multiple sources for accuracy and included only data from 2022 to 2025 studies. 4OVER4.COM's own data points come from 25 plus years of serving 150,000 plus businesses and tracking reorder rates, satisfaction scores, and delivery performance internally.
%22%2F%3E%3Ccircle%20cx%3D%2240%22%20cy%3D%2249%22%20r%3D%2225%22%20fill%3D%22%232dd4bf%22%20opacity%3D%220.15%22%2F%3E%3Ccircle%20cx%3D%2278%22%20cy%3D%2258%22%20r%3D%2214%22%20fill%3D%22%232dd4bf%22%20opacity%3D%220.1%22%2F%3E%3Crect%20x%3D%2270%22%20y%3D%2228%22%20width%3D%2225%22%20height%3D%2234%22%20rx%3D%224%22%20fill%3D%22%232dd4bf%22%20opacity%3D%220.08%22%20transform%3D%22rotate(35%2080%2030)%22%2F%3E%3C%2Fsvg%3E)
Get Started
Start the set: 100 cards at $17.57, 50 postcards at $16.48
Pick a branded piece, drop in your design or a free template, and we will print it sharp on premium stock and ship it on time.
Legal Disclaimer
Gold Standard guarantees apply to all standard orders placed through 4over4.com. Price match requires verifiable proof of a competitor's published price for an equivalent product with matching specifications and turnaround time. Satisfaction guarantee covers manufacturing defects and print quality issues. Contact support with order number and documentation.
Explore more
Brand guides, print products and marketing statistics
 Statistics Small Business Statistics Where brand loyalty fits into the bigger small business picture.
  Statistics Small Business Growth How loyalty connects to broader business performance.
  Statistics Small Business Marketing How marketing spend drives retention and repeat sales.
  Statistics Marketing Budget Benchmarks Where to spend so loyalty programs actually pay off.
  Statistics Small Business Failure Rate Why businesses that skip retention tend to struggle.
  Statistics Startup Statistics Generational spending and loyalty trends for new brands.
  Product Business Cards Put your brand in someone's hands, the first loyalty touchpoint.
  Showcase Print Showcase See how brands use print to build recognition and trust.
  Guarantees 5 Gold Guarantees Quality, price match, on-time delivery, service, satisfaction.
  FAQs Printing FAQs Answers on stock, sizes, proofs, and turnaround.
 Questions and answers
Common questions about brand loyalty data and trends
Retention, awareness, Gen Z, employer branding, and print, answered.
What are the most important brand loyalty statistics for small businesses?
The most impactful brand loyalty statistics for small businesses center on retention economics. Retaining existing customers costs 5 to 7 times less than acquiring new ones, and repeat customers spend 67 percent more on average. For small businesses with limited budgets, investing in loyalty through consistent branding and quality touchpoints delivers better ROI than constantly chasing new leads.
How does brand awareness affect customer loyalty?
Brand awareness statistics show a direct link to loyalty. It takes 5 to 7 impressions before someone remembers your brand, and consistent brand presentation across all channels increases revenue by up to 23 percent. Physical materials like business cards and branded packaging create higher-quality impressions than most digital ads because they are tangible and memorable.
Are Gen Z consumers less loyal to brands than older generations?
Gen Z brand loyalty statistics tell a detailed story. Traditional brand loyalty is lower among Gen Z at around 40 percent, but 65 percent of Gen Z consumers stay loyal to brands that align with their values. They are not disloyal, they just have different loyalty triggers. Purpose, authenticity, and tangible brand experiences matter more to this generation than legacy or habit.
How do employer branding statistics connect to customer loyalty?
Employer branding statistics show that internal brand strength directly impacts external loyalty. Companies with strong employer brands see 50 percent lower hiring costs and 28 percent lower turnover. Employees who believe in the brand become better customer advocates, creating a loyalty loop between internal culture and external customer experience.
Does print marketing actually improve brand loyalty?
Yes. Branding statistics from multiple studies confirm that physical materials build more trust than digital-only communications. Print achieves a 70 percent trust rating versus 42 percent for digital ads. Direct mail gets a 9 percent response rate compared to email's 1 percent. Printed brand touchpoints create emotional connections that drive repeat business. Visit our Showcase to see how businesses use print to build brand loyalty.
What is the ROI of investing in brand loyalty programs?
The lifetime value of a loyal customer is 10 times the value of their first purchase. Loyalty programs make 79 percent of consumers more likely to continue buying from a brand. Even simple gestures like branded thank-you cards and consistent packaging can shift repeat purchase rates a lot. One business reported going from 22 percent to 38 percent return customers after adding physical brand touches to orders.
How many brand impressions does it take to build recognition?
Brand recognition statistics indicate it takes 5 to 7 impressions before someone remembers your brand. Color usage increases brand recognition by up to 80 percent. The key is consistency across every touchpoint. Your website, social media, business cards, packaging, and signage should all use the same colors, fonts, and visual language.
