
What Is an Infographic? Types, Design Elements, and How to Make One


Sofia is our design and templates voice, built from the knowledge of our production team, with over 20 years in printing.
An infographic packs data, icons, and a clear layout into one visual a reader gets in a glance, and in print it most often runs as an 18 by 24 inch poster, a 24 by 36 inch large format poster or an 8.5 by 11 inch flyer. The data decides the type, and picking the wrong one is why most infographics read as decoration.
An infographic is a visual that combines short text, icons, charts, and a clear layout to explain data or an idea at a glance. The name blends "information" and "graphic." There are seven core types: statistical, timeline, process, comparison, geographic, informational, and instructional. Build one by defining a single goal, trimming your data, choosing the matching type, and designing around one clear headline, then print it as a poster or flyer so it works off the screen too.

Quick tips
Quick tips for making an infographic that works
Start with one clear goal, then cut every fact that does not support it. Pick the infographic type that fits your story, lead with your strongest number, and keep the palette to two or three colors. Use simple icons, plenty of whitespace, and one obvious top-to-bottom flow. Design at high resolution so the same file works on screen and blown up to poster size. 4OVER4.COM customers who plan for print from the start get infographics that look just as sharp on the wall as they do in a feed.
Sizes
Common infographic sizes, and the standard one to print
The standard printed infographic is an 18 by 24 inch poster, 24 by 36 inches is the common size for trade shows and lobbies, and 11 by 17 inches is the small end that doubles as a handout. A condensed version prints as an 8.5 by 11 inch flyer. Build the file at the printed size, at 300 DPI in CMYK, with 0.125 inch of bleed on any background that runs off the edge. Posters start at 50 for $108.75 in sizes from 11 by 17 to 22 by 28 inches, and large format posters run from 24 by 36 up to 48 by 96 inches with 2 business days of production.
What is an infographic?

An infographic is a single visual that blends short text, icons, charts, and a deliberate layout to explain data or an idea faster than a paragraph ever could. The word is a mash-up of "information" and "graphic," and that is exactly the job: take something that would take a page to read and let a reader understand it in a glance. One built for print starts at its finished size, 300 DPI and CMYK, rather than as a screen graphic stretched later.
Good infographics work because the brain reads images far faster than blocks of text. A well-built one guides the eye from a headline, through a few key points, to a clear takeaway. A survey summary, a workflow map, a two-option comparison: the format keeps attention exactly where a wall of words would lose it.
Infographics live everywhere: blog posts, social feeds, pitch decks, and printed pieces. And once the design is done, it does not have to stay on a screen. Plenty of 4OVER4.COM customers turn a finished infographic into wall art with poster printing or hand it out as a flyer.
How infographics benefit your business

Infographics earn their place because they make information easy to share and easy to remember. A reader who skims past a report will still absorb a clean visual, which is why marketing teams lean on them so heavily. One file built at 18 by 24 inches and 300 DPI can hang as an office poster and, reflowed, print as an 8.5 by 11 inch flyer.
- They boost comprehension. A visual explains a process or a set of numbers in seconds, so more of your audience actually gets the point.
- They travel well. A single strong graphic gets saved, screenshotted, and reposted, extending your reach without extra spend.
- They build authority. Presenting your own data clearly signals that you know your subject, which matters for both readers and search engines.
- They repurpose endlessly. One infographic becomes a social post, a slide, a printed poster, and a handout.
That last point is where print pays off. If your infographic supports a campaign, pair it with the rest of your marketing materials so your data, your brand, and your call to action all look like they belong together.
The 7 types of infographics
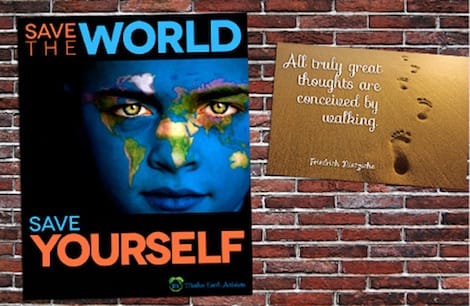
Not every story fits the same shape. Choosing the right type is the first real design decision, and it saves you from forcing data into a layout that fights it.
- Statistical. Built around numbers, percentages, and survey results, using charts and big figures to make the data land.
- Timeline. Shows how something unfolds over time, ideal for a company history or a project roadmap.
- Process. Breaks a workflow into numbered steps so a reader can follow it start to finish.
- Comparison. Sets two or more options side by side to make the trade-offs obvious.
- Geographic. Maps data onto locations, which suits regional trends or a store network.
- Informational. Organizes a topic into clear sections with headings and short text, no heavy data required.
- Instructional. Teaches a how-to, a close cousin of the process type but focused on doing rather than understanding.
Big, data-dense infographics read best when they are large. If yours has more than a handful of sections, plan to print it as a large format poster so nothing gets cramped.
Key design elements of a great infographic
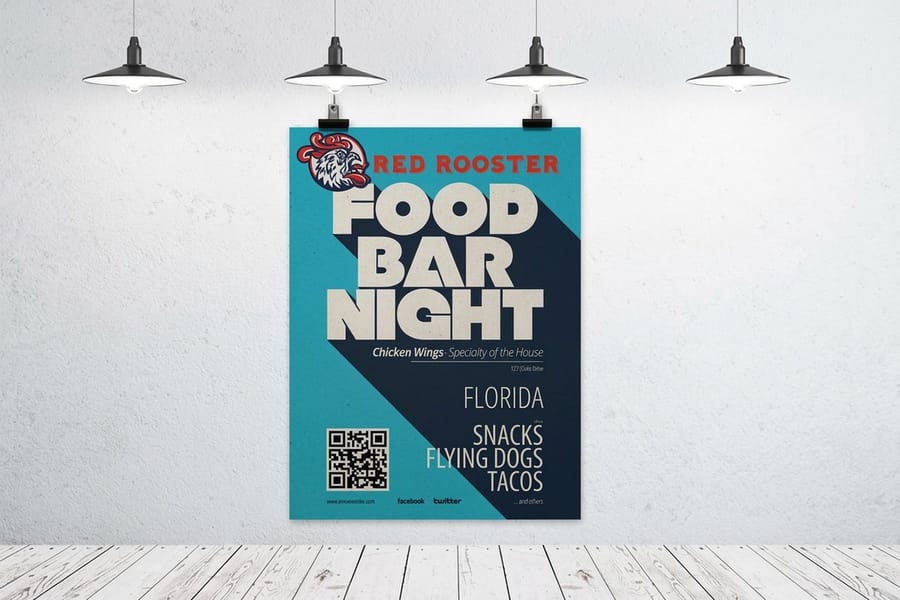
Once you know the type, five design elements do most of the heavy lifting. Get these right and the graphic almost designs itself.
Headline. One clear title that states the payoff. If a reader only reads the headline, they should still learn something.
Layout and flow. Guide the eye in a single obvious direction, usually top to bottom. Use whitespace to separate sections so nothing feels crowded.
Icons. Simple, consistent icons replace words and speed up reading. Keep them in one style so the piece feels unified.
Color harmony. Pick two or three brand colors and stick to them. Color should group related ideas and highlight the one number that matters, not decorate every corner.
Data visualization. Match the chart to the data: bars for comparisons, lines for trends, a single big number for one striking stat. Skip the pie chart for anything with more than a few slices.
Print resolution. If the graphic is heading for a wall, build it for press from the first click. Set the canvas to the finished poster size, 18x24 or 24x36 inches, at 300 DPI rather than the 72 DPI a browser is happy with, because a screen-resolution export enlarges soft and the small data labels are the first thing to go fuzzy. Keep icons and charts as vector art, drawn or placed as vectors instead of flattened screenshots, so every line and axis label stays sharp at full size. Work in CMYK and check the screen-bright colors before you commit: electric blue, neon green, and pure RGB red all shift on paper, so choosing your two or three brand colors in CMYK saves a reprint. Then make the smallest type a size you can read at arm's length, add a little more, and keep numbers and captions inside a quiet margin away from the trim. Our guide to big poster printing sizes and the resolution each one needs covers the larger formats.
You do not need pro software to pull this together. The free Online Designer at 4OVER4.COM lets you arrange text, icons, and color in the browser, then send the finished file straight to print.
How to make an infographic, step by step

Making an infographic is less about artistic talent and more about a clear process. Follow these six steps and you will end up with something worth printing.
- Define one goal. Decide the single question your infographic answers before you touch any design tool.
- Gather and trim your data. Collect the facts, then cut everything that does not serve the goal.
- Pick the right type. Statistical, timeline, process, or one of the others, based on the story your data tells.
- Sketch the flow. Rough out the order of sections so the eye moves logically from headline to conclusion.
- Design it. Add your headline, icons, charts, and a tight color palette in the Online Designer or your tool of choice.
- Export and print. Save a high-resolution file at the printed size, 18 by 24 or 24 by 36 inches for a poster at 300 DPI in CMYK, and turn it into a poster or handout so it works offline too.
If you are new to laying out print files, our guide on how to make flyers walks through the same setup habits, from bleed to resolution, that keep a printed infographic crisp.
Tips for designing effective infographics

A few habits separate an infographic people share from one they scroll past.
Lead with the strongest stat. Put your most surprising number near the top where it grabs attention and earns the scroll.
Keep text short. Every label should read in under a second. If a sentence needs a comma, it probably belongs in the article, not the graphic.
Give data room to breathe. Crowding kills comprehension. Whitespace is a feature, not wasted space.
Stay on brand. Use your real fonts and colors so the piece reinforces your identity every time it gets shared. For a sense of strong visual identity, browse these graphic design portfolio examples.
Design for the final size. A graphic that looks fine on a phone can fall apart blown up to poster size, so decide early whether it will live on a screen, on a wall, or in a hand.
Common infographic mistakes to avoid

Even good designers trip over the same handful of errors. Avoid these and your infographic stays clear.
Cramming in too much. An infographic is not a report. If you cannot cut it to one focused message, split it into two.
Chart junk. 3D effects, drop shadows, and gradients on bars distort the data and slow the reader down. Keep charts flat and honest.
Weak hierarchy. If everything is the same size, nothing stands out. Make the headline and the key number clearly biggest.
Too many colors. A rainbow palette confuses more than it helps. Two or three colors is plenty.
Low-resolution files. A graphic that looks fine online can turn blurry in print, so export at 300 DPI before ordering. The same care that goes into choosing the right paper for flyers applies here: quality input, quality output.
What is an infographic poster?

An infographic poster is the same story rebuilt for a wall instead of a scroll: one sheet, one glance, every chart and label visible at the same time. A web infographic can run several screens tall because the reader keeps scrolling. A poster has to land its headline from across a room, then reward the person who walks up close and reads the small numbers.
The sizes it usually prints at. 18x24 inches is the everyday choice for an office wall, a classroom, or a clinic hallway, read from a few feet away. 24x36 inches is the trade show and lobby size, where the headline has to carry across an aisle and a long data set still has room to breathe. 11x17 inches is the small end, useful when the same artwork has to double as an oversized handout people fold and take with them. Portrait suits timelines and top-to-bottom flows; landscape suits side-by-side comparisons and wide bar charts.
How it differs from a web infographic. Four things change on press. The aspect ratio is fixed, so a very tall web piece has to be re-flowed into two or three columns rather than stretched. Resolution is measured at final size, not on screen, so the artwork is built at 300 DPI at the printed dimensions. Color moves from RGB to CMYK, so screen-bright cyans, neon greens, and pure RGB reds need checking before they go to plate. And nothing is interactive: every tooltip, hover label, and click-to-expand footnote either gets set in type on the sheet or gets cut.
Keep body type readable at arm's length, hold charts and captions inside a quiet margin so nothing important sits near the trim, and leave 0.125 inches of bleed on any background color that runs off the edge. Get those right and the poster carries more data, more legibly, than the same file ever did in a browser tab.
Printing your infographic as posters and handouts
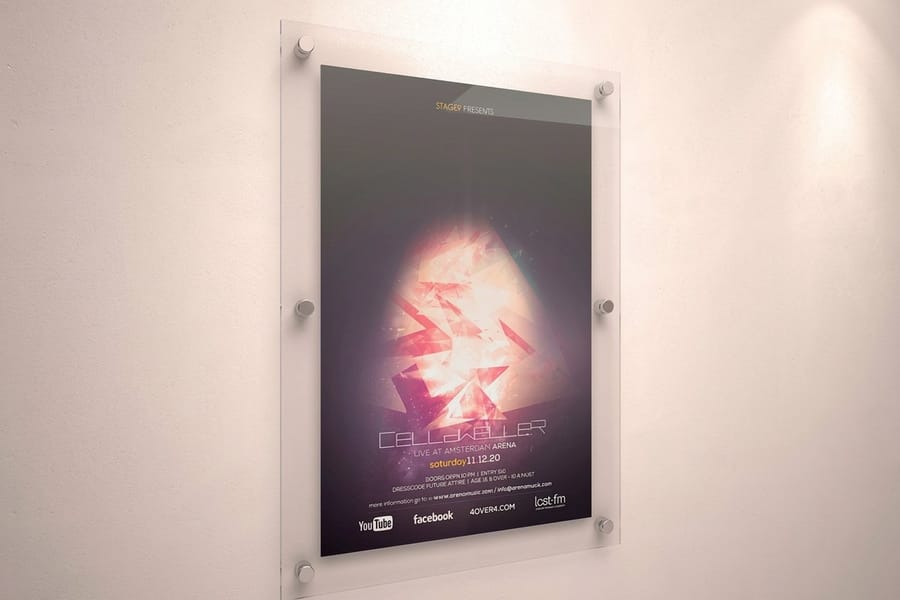
An infographic that only lives online is doing half its job. Print gives it a second life in places a screen cannot reach: a trade show booth, an office wall, a customer's hand.
As a poster. Data-heavy or tall infographics belong on the wall. Standard posters suit most sizes, and for large, detailed pieces a large format poster keeps every label sharp. Both print in vivid color on quality stock at 4OVER4.COM, and our guide to large format poster sizes compares the bigger options. Pick your size, stock, and finish, then print your infographic poster once the file is final: 18x24 for a wall people stand in front of, 24x36 when the headline has to read across a room.
As a handout. A condensed version of your infographic makes a memorable leave-behind. Printed as a flyer, it turns a quick conversation into something a prospect keeps. Strip it back to the headline, the one number that matters, and a single chart, because a sheet held in the hand is read in seconds, not minutes.
Not sure which stock or finish shows your colors best? A matte or uncoated sheet keeps dense charts and small type easy to read under office lighting, while a gloss finish pushes photo-heavy panels and saturated brand color. Order a free sample pack first, or browse our full guide library for more print setup help. When your file is ready, upload it and we ship fast from our Queens, NY facility.
Wally explains infographics
Data becomes a story people actually remember
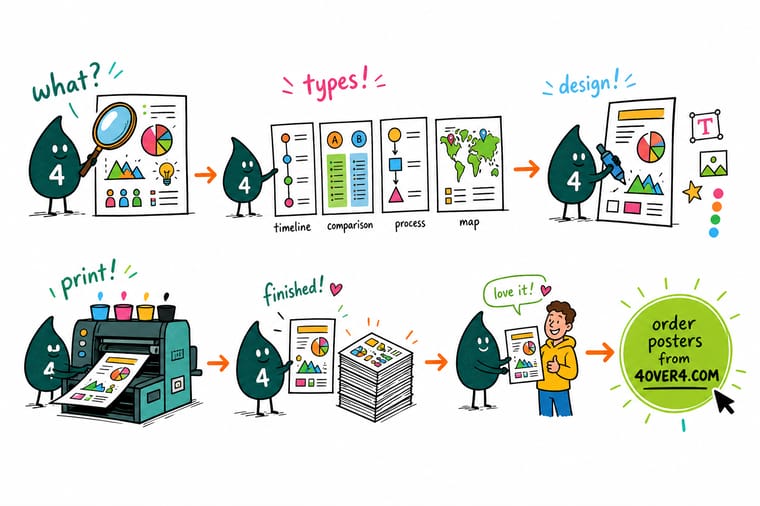
Wally treats an infographic as a shortcut for the reader's brain: one headline, a few honest charts, simple icons, and a color or two, arranged so the eye flows straight to the point. Say one thing well instead of ten things badly. And when the design is done, do not let it die in a feed. Print it big and sharp as a poster or hand it out as a flyer at 4OVER4.
Order poster printing →
Specs and pricing
Poster specs and pricing for your infographic
Posters run 50 for $108.75, which is $2.18 each, with live specs and price-per-unit below. They print in six sizes from 11 by 17 to 22 by 28 inches, on stocks from 100# gloss text to 14pt gloss cover and 8 mil synthetic plastic, with 5 business days of standard production.

| Quantity | Price Per Unit | Total |
|---|---|---|
| 50 | $2.18 | $108.75 |
| 100 | $1.64 | $163.67 |
| 200 | $1.01 | $202.11 |
| 300 | 80.2¢ | $240.55 |
| 400 | 69.7¢ | $278.99 |
| 500 | 63.5¢ | $317.44 |
| 600 | 55.8¢ | $335.02 |
| 700 | 50.4¢ | $352.59 |
Print it
Turn your infographic into print
Three routes to print: posters from 11 by 17 to 22 by 28 inches, large format posters from 24 by 36 up to 48 by 96 inches in 2 business days, and 8.5 by 11 inch flyers for the handout version.

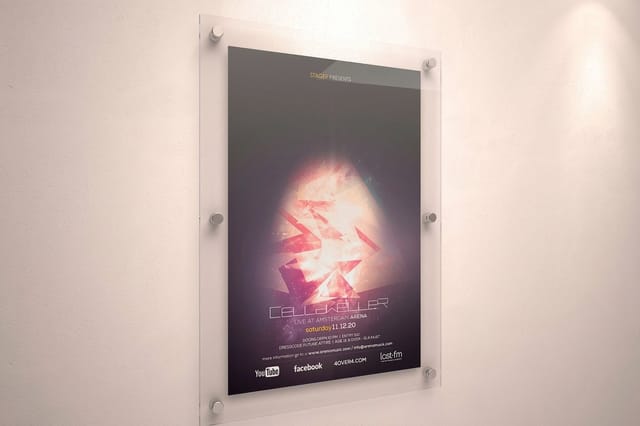

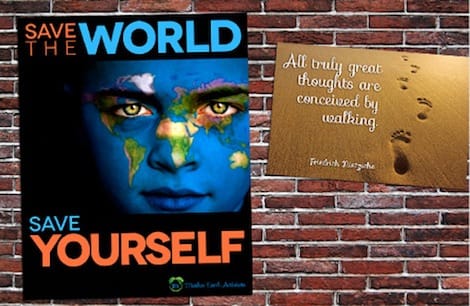
Customer data posters
Data posters we printed for customers








Explore more
Where to go next



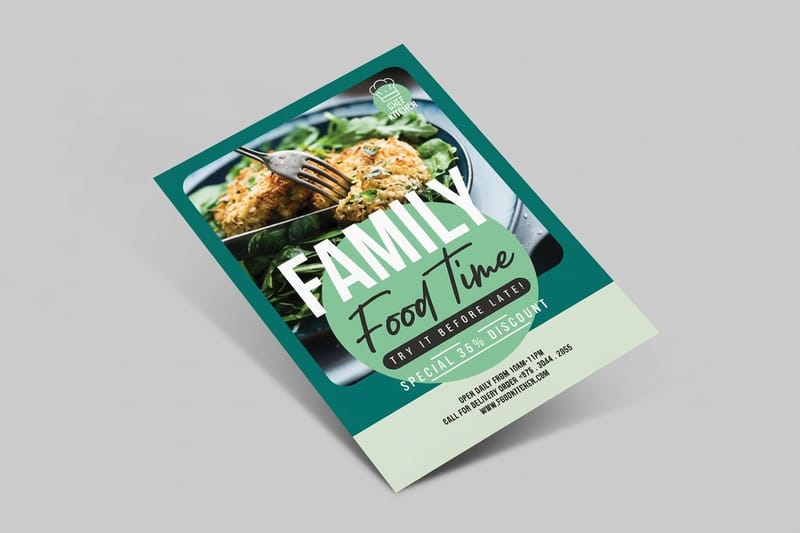
By the numbers
Standard posters and large format side by side
Common Questions
Common questions about infographics
What is an infographic?
An infographic is a visual that combines short text, icons, charts, and a clear layout to explain data or an idea at a glance. The name blends "information" and "graphic." Instead of asking a reader to work through paragraphs, it guides the eye from a headline to a few key points to a single takeaway, which is why infographics get shared and remembered far more than plain text.
Which infographic type fits the data I already have?
Match the type to your story. Use a statistical infographic for survey results and numbers, a timeline for anything that unfolds over time, a process or instructional layout for step-by-step content, a comparison for weighing options side by side, and a geographic version for location-based data. Decide this before you design, because the type dictates the layout.
What does it cost to print an infographic as a poster?
Poster pricing depends on the size, stock, quantity, and finish you pick, so the price updates live in the configurator rather than sitting at a fixed number. Standard posters start lower for smaller sizes, and large format posters scale up for big, detailed pieces. Use the specs and pricing widget on this page to see your exact price per unit.
What sizes, stocks, and finishes work best for a printed infographic?
Tall, data-heavy infographics suit larger portrait sizes so every label stays readable, while a condensed version works well as a flyer handout. For stock, a matte finish reduces glare on a wall and a gloss finish makes colors pop. If you are unsure, order a free sample pack from 4OVER4.COM to see the options in person before you commit.
How long does infographic poster printing take to ship?
Turnaround depends on the product and the options you choose, and 4OVER4.COM offers fast production with same-day shipping available on many items from our Queens, NY facility. The live turnaround for your exact configuration appears in the product page once you select a size and quantity.
Do I need design software to make an infographic?
No. While designers reach for tools like Illustrator, you can build a clean infographic with the free Online Designer at 4OVER4.COM or any template-based tool. The design habits matter more than the software: one clear goal, trimmed data, simple icons, a tight color palette, and a high-resolution export ready for print.
What is an infographic poster?
An infographic poster is a single printed sheet that carries the whole graphic at once, headline, charts, icons, and conclusion, sized to be read on a wall instead of scrolled on a screen. Because there is no scrolling and no hover, the layout is re-flowed into columns and every tooltip or click-to-expand note is set in type on the sheet. Build the artwork at 300 DPI at final size, keep the color in CMYK, and it prints in vivid color on quality stock at 4OVER4.COM.
What size should an infographic poster be?
18x24 inches is the everyday size for an office wall, a classroom, or a clinic hallway, where people read from a few feet away. Step up to 24x36 inches when the poster has to be read from across a trade show aisle or when the data set runs long and needs room to breathe. 11x17 inches works when the same file has to double as an oversized handout people take with them. Portrait suits timelines and top-to-bottom process flows; landscape suits side-by-side comparisons and wide bar charts. Whichever you pick, set the canvas to that exact size before you start designing so nothing has to be enlarged later.
Get Started
Print your infographic as 50 posters from $108.75
Upload your finished design, pick a size and stock, and we print a crisp, full-color poster or flyer that carries your data off the screen and into the room.
Legal Disclaimer
Gold Standard guarantees apply to all standard orders placed through 4over4.com. Price match requires verifiable proof of a competitor's published price for an equivalent product with matching specifications and turnaround time. Satisfaction guarantee covers manufacturing defects and print quality issues. Contact support with order number and documentation.
